
MATLAB: An Introduction with Applications
6th Edition
ISBN: 9781119256830
Author: Amos Gilat
Publisher: John Wiley & Sons Inc
expand_more
expand_more
format_list_bulleted
Related questions
Question
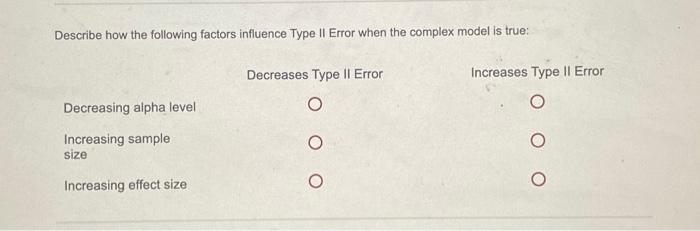

Transcribed Image Text:Describe how the following factors influence Type II Error when the complex model is true:
Decreasing alpha level
Increasing sample
size
Increasing effect size
Decreases Type II Error
O
Increases Type II Error
Expert Solution
This question has been solved!
Explore an expertly crafted, step-by-step solution for a thorough understanding of key concepts.

Step by stepSolved in 3 steps

Knowledge Booster

Similar questions
- #3. What is the least squares regression line for the following set of data? y-hat = 2.18x + 27.74 y-hat = 2.14x + 27.44 y-hat = 1.94x + 26.24 y-hat =1.86x + 26.28arrow_forward(d) Determine the equation of the regression line using least squares method.(e) What is the expected breakdown for an eleven year old machine?arrow_forwardSolve the second question in regression analysisarrow_forward
- 8. You collect data on people's height and study the relationship between gender and height. A regression of the height on a binary variable (Female), which takes a value of one for females and zero otherwise, yields the following result: Height = 71.0- 4.84 x Female, R2 = 0.40, SER = 2.0 (0.3) (0.57) (a) What is the sample average male height? (b) What is the sample average female height? I (c) How to interpret the slope coefficient -4.84? (d) Is the error term in the regression more likely to be heteroskedastic or homoscedastic? Why? R English (United States) D'Focus Page 9 of 10 920 words 100%arrow_forwardThe following data represent the speed at which a ball was hit (in miles per hour) and the distance it traveled (in feet) for a random sample of home runs in a Major League baseball game in 2018. Complete parts (a) through (f). Click here to view the data. Click here to view the critical values of the corelation coefficient (a) Find the least-squares regression line treating speed at which the ball was hit as the explanatory variable and distance the ball traveled as the response variable. y (Round to three decimal places as needed.) (b) Interpret the slope and y-intercept, if appropriate. Begin by interpreting the slope. Data table O A. The slope of this least-squares regression line says that the distance the ball travels increases by the slope with every 1 mile per hour increase in the speed that the ball was hit. O B. The slope of this least-squares regression line shows the increase in the speed that the ball was hit with every 1 foot increase in the distance that the ball was…arrow_forwardWe have estimated the impact of gross domestic product (GDP), energy consumption (ENERGY) and population (POP) on CO2 emiisions (CO2) in Cyprus. The results are as follows; Dependent Variable: CO2 Method: Least Squares Date: 04/20/17 Time: 09:46 Sample: 1990 2013 Included observations: 24 Variable Coefficient Std. Error t-Statistic Prob. C 2.002813 6.458672 0.310097 0.7597 GDP 0.022114 0.011872 1.862670 0.0773 ENERGY -0.734352 0.328388 -2.236233 0.0369 POP 0.203927 0.293686 0.694371 0.4954 R-squared 0.825079 Mean dependent var 3.625982 Adjusted R-squared 0.798841 S.D. dependent var 0.108170 S.E. of regression 0.048515 Akaike info criterion -3.062883 Sum squared resid 0.047074 Schwarz criterion -2.866541 Log likelihood 40.75460 Hannan-Quinn criter. -3.010793 F-statistic 31.44583 Durbin-Watson stat 1.410912…arrow_forward
- An article on the cost of housing in California that appeared in the San Luis Obispo Tribunet included the following statement: "In Northern California, people from the San Francisco Bay area pushed into the Central Valley, benefiting from home prices that dropped on average $4000 for every mile traveled east of the Bay area." If this statement is correct, what is the slope of the least-squares regression line, ý = a + bx, where y = house price (in dollars) and x = distance east of the Bay (in miles)? Your answer cannot be understood or graded. More Informationarrow_forwardBivariate data obtained for the paired variables x and y are shown below, in the table labeled "Sample data." These data are plotted in the scatter plot in Figure 1, which also displays the least-squares regression line for the data. The equation for this line is y = 14.87+0.88x. In the "Calculations" table are calculations involving the observed y-values, the mean y of these values, and the values y predicted from the regression equation. Sample data Calculations 160+ x y (x-1)² (-5)² (v-^^)² 150+ 107.2 110.7 396.0100 457.7032 2.2320 122.0 130.3 140- 0.0900 70.0569 65.1249 131.5 122.1 130- 72.2500 0.0001 72.0801 142.5 129.9 120. 0.4900 93.5089 107.5369 152.5 160.0 110- 864.3600 341.1409 119.4649 Send data to Excel LL 130 130 140 150 160 Column sum: 1333.2000 Column sum: 962.4100 Column sum: 366.4388 Figure 1 Answer the following. (a) The least-squares regression line given above is said to be a line that "best fits" the sample data. The term "best fits" is used because the line has an…arrow_forwardAn engineer wants to determine how the weight of a gas-powered car, x, affects gas mileage, y. The accompanying data represent the weights of various domestic cars and their miles per gallon in the city for the most recent model year. Complete parts (a) Find the least-squares regression line treating weight as the explanatory variable and miles per gallon as the response variable.arrow_forward
- Espan Interpreting technology: The following display from the TI-84 Plus calculator presents the least-squares regression line for predicting the price of a certain stock (y) from the prime interest rate in percent (x). LinReg y=a+bx a = 2.39562641 do b=0.37929688 2=0.4130321711 r=0.64267579 Part: 0 /3 Part 1 of 3 Write the equation of the least-squares regression line. Use the full accuracy shown in the calculator output (do not round your answers). Regression line equation: y = Part 2 of 3 What is the correlation between the interest rate and the yield of the stock? The correlation coefficient is Part: 2 /3 Part 3 of 3 Predict the price when the prime interest rate is 6%. Round the answer to at least four decimal places. When the prime interest rate is 6%, the price is predicted to bearrow_forwardA year-long fitness center study sought to determine if there is a relationship between the amount of muscle mass gained y(kilograms) and the weekly time spent working out under the guidance of a trainer x(minutes). The resulting least-squares regression line for the study is y=2.04 + 0.12x A) predictions using this equation will be fairly good since about 95% of the variation in muscle mass can be explained by the linear relationship with time spent working out. B)Predictions using this equation will be faily good since about 90.25% of the variation in muscle mass can be explained by the linear relationship with time spent working out C)Predictions using this equation will be fairly poor since only about 95% of the variation in muscle mass can be explained by the linear relationship with time spent working out D) Predictions using this equation will be fairly poor since only about 90.25% of the variation in muscle mass can be explained by the linear relationship with time spent…arrow_forward
arrow_back_ios
arrow_forward_ios
Recommended textbooks for you
- MATLAB: An Introduction with ApplicationsStatisticsISBN:9781119256830Author:Amos GilatPublisher:John Wiley & Sons Inc
 Probability and Statistics for Engineering and th...StatisticsISBN:9781305251809Author:Jay L. DevorePublisher:Cengage Learning
 Statistics for The Behavioral Sciences (MindTap C...StatisticsISBN:9781305504912Author:Frederick J Gravetter, Larry B. WallnauPublisher:Cengage Learning
  Elementary Statistics: Picturing the World (7th E...StatisticsISBN:9780134683416Author:Ron Larson, Betsy FarberPublisher:PEARSON
 The Basic Practice of StatisticsStatisticsISBN:9781319042578Author:David S. Moore, William I. Notz, Michael A. FlignerPublisher:W. H. Freeman
 Introduction to the Practice of StatisticsStatisticsISBN:9781319013387Author:David S. Moore, George P. McCabe, Bruce A. CraigPublisher:W. H. Freeman
MATLAB: An Introduction with Applications
Statistics
ISBN:9781119256830
Author:Amos Gilat
Publisher:John Wiley & Sons Inc
Probability and Statistics for Engineering and th...
Statistics
ISBN:9781305251809
Author:Jay L. Devore
Publisher:Cengage Learning
Statistics for The Behavioral Sciences (MindTap C...
Statistics
ISBN:9781305504912
Author:Frederick J Gravetter, Larry B. Wallnau
Publisher:Cengage Learning
Elementary Statistics: Picturing the World (7th E...
Statistics
ISBN:9780134683416
Author:Ron Larson, Betsy Farber
Publisher:PEARSON
The Basic Practice of Statistics
Statistics
ISBN:9781319042578
Author:David S. Moore, William I. Notz, Michael A. Fligner
Publisher:W. H. Freeman
Introduction to the Practice of Statistics
Statistics
ISBN:9781319013387
Author:David S. Moore, George P. McCabe, Bruce A. Craig
Publisher:W. H. Freeman