MATLAB: An Introduction with Applications
6th Edition
ISBN: 9781119256830
Author: Amos Gilat
Publisher: John Wiley & Sons Inc
expand_more
expand_more
format_list_bulleted
Question
-
Derive the two expressions for the IS and LM equilibrium relationships respectively. Sketch a graph of the two relationships.

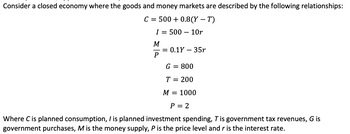
Transcribed Image Text:Consider a closed economy where the goods and money markets are described by the following relationships:
C = 500+ 0.8(Y – T)
-
I = 500 10r
M
P
= 0.1Y - 35r
G = 800
T = 200
M = 1000
P = 2
Where C is planned consumption, I is planned investment spending, T is government tax revenues, G is
government purchases, M is the money supply, P is the price level and r is the interest rate.
Expert Solution
This question has been solved!
Explore an expertly crafted, step-by-step solution for a thorough understanding of key concepts.
Step by stepSolved in 2 steps with 1 images

Knowledge Booster
Similar questions
- I need help with this problemarrow_forwarda. find the equilibrium point (both the p and q) b. find new equilibrium point with a $0.40 tax imposed on the suplier (both p and q)arrow_forwardConsider the demand (D) and supply (S) functions D = 14 - P and S = P² + 3P +2. (P is the unit price by dollars.) 1. Find the domain of the function D = D(P) in this context. 2. Find the equilibrium price Pr. What happens if P > P* (explain in this context)? ( 3. Sketch both the demand and supply curves in one coordinate system. Identify the equilibrium point...arrow_forward
- The cost function for a species of wild fish is estimated to be a function C(x) where x is the number of millions of pounds of this fish caught and C is the cost in millions of dollars. Two points that are on the graph are (x, C) = (3, 0.103) and (x, C) = (6, 0.133). Using this information and assuming a linear model, determine a cost function. C(x) =arrow_forwardThe data in the following table show five students' reading test scores and final exam grades in a history class. Reading Test Score, x 8.5 9.4 10.0 11.4 12.0 History Final Exam Grade, y 66 68 78 87 92 (a) Use the points (8.5, 66) and (10.0, 78) to find a linear model that will predict a student's final exam grade, y, given his or her reading test score, x. y= (b) Use your linear model to estimate a student's final exam grade in the history class given that the student's reading test score was 10.5.arrow_forward
arrow_back_ios
arrow_forward_ios
Recommended textbooks for you
 MATLAB: An Introduction with ApplicationsStatisticsISBN:9781119256830Author:Amos GilatPublisher:John Wiley & Sons Inc
 Probability and Statistics for Engineering and th...StatisticsISBN:9781305251809Author:Jay L. DevorePublisher:Cengage Learning
 Statistics for The Behavioral Sciences (MindTap C...StatisticsISBN:9781305504912Author:Frederick J Gravetter, Larry B. WallnauPublisher:Cengage Learning
 Elementary Statistics: Picturing the World (7th E...StatisticsISBN:9780134683416Author:Ron Larson, Betsy FarberPublisher:PEARSON
 The Basic Practice of StatisticsStatisticsISBN:9781319042578Author:David S. Moore, William I. Notz, Michael A. FlignerPublisher:W. H. Freeman
 Introduction to the Practice of StatisticsStatisticsISBN:9781319013387Author:David S. Moore, George P. McCabe, Bruce A. CraigPublisher:W. H. Freeman

MATLAB: An Introduction with Applications
Statistics
ISBN:9781119256830
Author:Amos Gilat
Publisher:John Wiley & Sons Inc

Probability and Statistics for Engineering and th...
Statistics
ISBN:9781305251809
Author:Jay L. Devore
Publisher:Cengage Learning

Statistics for The Behavioral Sciences (MindTap C...
Statistics
ISBN:9781305504912
Author:Frederick J Gravetter, Larry B. Wallnau
Publisher:Cengage Learning

Elementary Statistics: Picturing the World (7th E...
Statistics
ISBN:9780134683416
Author:Ron Larson, Betsy Farber
Publisher:PEARSON

The Basic Practice of Statistics
Statistics
ISBN:9781319042578
Author:David S. Moore, William I. Notz, Michael A. Fligner
Publisher:W. H. Freeman

Introduction to the Practice of Statistics
Statistics
ISBN:9781319013387
Author:David S. Moore, George P. McCabe, Bruce A. Craig
Publisher:W. H. Freeman