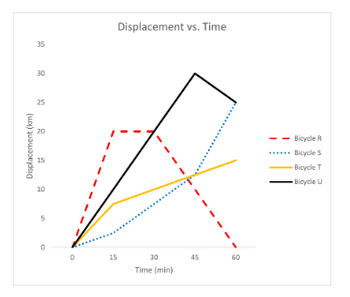
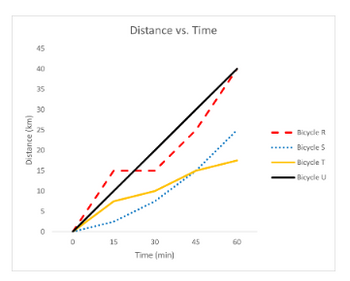
Identify which of the cyclists ended their trip closest to home. Which cyclists did not end their trip closest to home? Be sure to use evidence to support your claim and explain your reasoning. Answer in complete sentences.
Use CER, claim, evidence, and reasoning. Claim is your answer, evidence is from the pictures, and reasoning is your explanation.


Solution:
The displacement time graph is showing the distance covered during the time. The distance away from the home is indicated on the y-axis. If the distance on the y-axis is bigger, the distance from the home is also higher. On the other hand, in the end, if the distance is lower on this axis, the body is nearer to his house.
Trending nowThis is a popular solution!
Step by stepSolved in 2 steps

- What is meant by instantaneous velocity, average velocity and final velocity?Define acceleration, force, energy, potential energy and kinetic energy and write the formula for each.A force is a vector quantity capable of producing motion or a change in motion, that is, a change invelocity or an accelerationWhat are the units of force and energy in CHS, MKS, and FPS units?What is static friction and what is kinetic friction?Explain the law of conservation of energy.arrow_forwardComplete any four from below. Must show all steps used to get your final answer. 3. Given a speed of 90 kilometers/hour, convert the speed to miles per hourarrow_forwardProvide your calculations, including all relevant steps are included and your units are labeled. The plane carrying the supplies will be cruising at a constant velocity of 250 miles per hour relative to the ground and at a height of 2,650 meters above the target site. Using this information, create a supply drop plan including all required information and calculations outlined below. As you are completing your supply drop plan, remember that correct SI units are a required component of your calculations and descriptions. A) Provide your calculations, including all relevant steps are included and your units are labeled. B) Describe the components of the kinematics equations used in your initial calculations below.arrow_forward
- What is the average speed of a car that travels one mile around a Nascar racetrack in 24.6 seconds in mph? Show the formula you are using, and your work.arrow_forwardSolve the following problem and show your complete solutions. explain your answers for better understanding.arrow_forwardSolve the following problem and show your complete solutions. explain your answers for better understanding.arrow_forward
- Describe the relationship between Mass and Acceleration - is this linear? Why or why not? Use your graph and your data table as evidence to support your answer.arrow_forwardProblem 2. Planetary Body Composition: Density (Links to an external site.) of the Earth (Palen, et. al., 1st Edition, Chapter 6, problem 70) Earth’s mean (Links to an external site.) radius is 6,378 km and its mass is 5.97 x 1024 kg. CALCULATE Earth’s average (Links to an external site.) density. SHOW YOUR WORK. DO NOT LOOK UP THIS VALUE! The average density of Earth’s crust is 2,600 kg/m3. What does this tell you about Earth’s interior?arrow_forwardAnswer all questions in the space provided. Show ALL your steps in your calculations. Answer in complete sentences and therefore statements.arrow_forward