
MATLAB: An Introduction with Applications
6th Edition
ISBN: 9781119256830
Author: Amos Gilat
Publisher: John Wiley & Sons Inc
expand_more
expand_more
format_list_bulleted
Related questions
Question
thumb_up100%

Transcribed Image Text:**Question:**
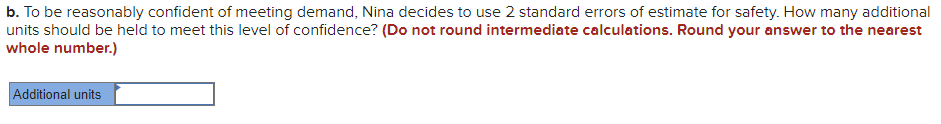
b. To be reasonably confident of meeting demand, Nina decides to use 2 standard errors of estimate for safety. How many additional units should be held to meet this level of confidence? (Do not round intermediate calculations. Round your answer to the nearest whole number.)
**Input Box Label:**
Additional units

Transcribed Image Text:**Problem 18-14 (Algo)**
Demand for stereo headphones and MP3 players for joggers has caused Nina Industries to grow almost 50 percent over the past year. The number of joggers continues to expand, so Nina expects demand for headsets to also expand, because, as yet, no safety laws have been passed to prevent joggers from wearing them. Demand for the players for last year was as follows:
| MONTH | DEMAND (UNITS) |
|------------|----------------|
| January | 4,000 |
| February | 4,100 |
| March | 3,800 |
| April | 4,200 |
| May | 4,850 |
| June | 4,500 |
| July | 5,150 |
| August | 4,750 |
| September | 5,250 |
| October | 5,550 |
| November | 6,150 |
| December | 5,850 |
**a. Using linear regression analysis, what would you estimate demand to be for each month next year? (Do not round intermediate calculations. Round your answers to 2 decimal places.)**
| Month | Forecast |
|------------|----------------|
| January | |
| February | |
| March | |
| April | |
| May | |
| June | |
| July | |
| August | |
| September | |
| October | |
| November | |
| December | |
**Explanation of a Table:**
- **Upper Table:** Shows the past year's demand for each month in units. This table is essential for analyzing trends and making future forecasts based on historical data.
- **Lower Table:** Empty table intended for entering forecasted demand for each month of the upcoming year using linear regression analysis. The calculations should be rounded to two decimal places, providing precise demand estimations.
Expert Solution
This question has been solved!
Explore an expertly crafted, step-by-step solution for a thorough understanding of key concepts.

This is a popular solution

Trending nowThis is a popular solution!

Step by stepSolved in 4 steps with 1 images

Knowledge Booster

Similar questions
- An electronics retailer list the sales (in thousands) of certain products in three cities for the prior quarter. During that period tablets sold for $243, laptops sold for $763, cell phones sold for $158, and DVR sold for $661. City 1 City 2 City 3 Tablets 78 68 42 Laptop Computers 53 30 34 Cell Phones 54 67 61 Personal DVR 66 41 48 City 1's total sales : thousand dollars City 2's total sales : thousand dollars City 3's total sales : thousand dollarsarrow_forwardIt is known that in any given year, • 90% of the people in a city move to the suburbs; • 80% of the people in the suburbs do not move to the city. Given an initial city population of 55,000 and an initial suburb population of 77,000, what are the long-term population levels of the city and the suburb?arrow_forwardplease answer correctly:arrow_forward
- Step 3: Assess the Evidence (Calculate the test statistic for the observed sample mean. Sketch the T-distribution and identify the position of the observed test statistic. Shade the area that represents the P-value. Use the test statistic to find the P-value.)arrow_forwardAn analyst in the real estate business is interested in the relationship between the cost of the monthly rent of an apartment and the size of an apartment, in big cities. She gathers data for apartment buildings in 12 cities in 12 different states. In each city, she gets the numbers for at least 5 different buildings and at least 40 apartments in each building. She reaches the following conclusion: the rental cost of a 2-bedroom apartment is 50% more than the rental cost of a 1-bedroom apartment, and the rental cost of a 3-bedroom apartment is 50% more than the rental cost of a 2-bedroom apartment. Based on the paragraph, what is the minimum number of apartments she collected data on? Do you think her sample was large enough to be statistically valid? Based on the paragraph, are there any apartments or apartment buildings that she would have excluded from her study? Do you see any bias in how she selected apartments for her study? Based on the paragraph, is there a positive…arrow_forward5 Imagine that a company sells portable walkie-talkie radios to construction crews. The batteries for these radios last for an average of 55 hours. The purchasing manager for this company receives a brochure in the mail that advertises a new brand of batteries. This new brand of batteries is cheaper than the brand that the company currently uses. However, the purchasing manager is concerned that the cheaper batteries may have a shorter average battery life than the current brand. (Note: The number of hours that batteries last is called their battery life.) The pricing manager installs 40 randomly selected batteries of the cheaper brand in the company's walkie-talkie radios. He finds that the mean battery life for the sample is 52 hours, with a standard deviation of 10 hours. He wants to perform a statistical test at the 1% level of significance to determine whether the cheaper batteries have a shorter average battery life span than the average life span of the brand of batteries the…arrow_forward
- You are the VP, Advertising for “Yo’ Mama” brand, a fashion label that caters to the young, trendy crowd with an urban, hip-hop image. While your customer base has traditionally been largely African-American, you have recognized a tremendous influx of Hispanic consumers into your market. You are preparing for next week’s annual budget meetings and you have decided to recommend an Hispanic-focused advertising campaign if the average monthly per store sales to Hispanic customers are at least the same as the average monthly per store sales to African-American customers in a sample of typical stores (sales data given below). Using an alpha of .05 and the 5-step hypothesis testing process, what will you recommend? Hint: Think about how many data points you actually have.arrow_forwardCellulon, a manufacturer of home insulation, wants to develop guidelines for builders and consumers on how the thickness of the insulation in the attic of a home and the outdoor temperature affect natural gas consumption. In the laboratory, it varied the insulation thickness and temperature. A few of the findings are: Monthly Natural Gas Consumption (cubic feet), Thickness of Insulation (inches), Outdoor Temperature (ºF), y x1 x2 30.3 6.0 40.0 24.2 12 40 27.9 8 49 On the basis of the sample results, the regression equation is: yˆy^ = 56.26 − 0.66x1 − 0.59x2 How much natural gas can homeowners expect to use per month if they install 6 inches of insulation and the outdoor temperature is 40 degrees F? (Round your answer to 2 decimal places.) What effect would installing 7 inches of insulation instead of 6 have on the monthly natural gas consumption (assuming the outdoor temperature remains at 40 degrees F)? (Round your answers…arrow_forwardAn interdepartmental task force is being formed to investigate an increase in violent crimes. 1/5 of the task force will be police officers from the local precinct. 1/4 will be ATF agents, and the remaining 22 will be from the FBI. How many people are participating in the task force?arrow_forward
- Turnover is planned at 2.5 for the six-month peris starting February 1 through July 31. Average weekly sales for that period are $75,000. What average stock should be carried in this situation? $800,000 $900,000 O $720,000 $780,000arrow_forwardG.97.arrow_forwardAn entrepreneur who owns and operates two businesses (A and B) would like to analyze their profitability. They would like your help in the analysis. They give you the annual net profit (in thousands of $) for each business from 2008-2020. Table 1: Annual Net Profits for Businesses A and B Business Year Profit Business Year Profit 2008 -50 2008 -10 2009 57 2009 30 2010 71 2010 27 2011 64 2011 22 2012 60 2012 21 2013 50 2013 20 A 2014 41 2014 24 2015 59 2015 24 2016 71 2016 32 2017 71 2017 36 2018 74 2018 37 019 81 20 40 2020 97 2020 49 a. Suppose you want to graph the distribution of profits. Explain why using only one stem- plot might not be optimal for the analysis. b. Describe the correct stemplot to use. Generate this stemplot. Explain your steps. What can you say about the distribution from this stemplot? c. When are stemplots useful? And why is that? d. Suppose that instead of having 26 observations you have 200 observations. What graph should you generate? e. What other type of…arrow_forward
arrow_back_ios
SEE MORE QUESTIONS
arrow_forward_ios
Recommended textbooks for you
- MATLAB: An Introduction with ApplicationsStatisticsISBN:9781119256830Author:Amos GilatPublisher:John Wiley & Sons Inc
 Probability and Statistics for Engineering and th...StatisticsISBN:9781305251809Author:Jay L. DevorePublisher:Cengage Learning
 Statistics for The Behavioral Sciences (MindTap C...StatisticsISBN:9781305504912Author:Frederick J Gravetter, Larry B. WallnauPublisher:Cengage Learning
  Elementary Statistics: Picturing the World (7th E...StatisticsISBN:9780134683416Author:Ron Larson, Betsy FarberPublisher:PEARSON
 The Basic Practice of StatisticsStatisticsISBN:9781319042578Author:David S. Moore, William I. Notz, Michael A. FlignerPublisher:W. H. Freeman
 Introduction to the Practice of StatisticsStatisticsISBN:9781319013387Author:David S. Moore, George P. McCabe, Bruce A. CraigPublisher:W. H. Freeman
MATLAB: An Introduction with Applications
Statistics
ISBN:9781119256830
Author:Amos Gilat
Publisher:John Wiley & Sons Inc
Probability and Statistics for Engineering and th...
Statistics
ISBN:9781305251809
Author:Jay L. Devore
Publisher:Cengage Learning
Statistics for The Behavioral Sciences (MindTap C...
Statistics
ISBN:9781305504912
Author:Frederick J Gravetter, Larry B. Wallnau
Publisher:Cengage Learning
Elementary Statistics: Picturing the World (7th E...
Statistics
ISBN:9780134683416
Author:Ron Larson, Betsy Farber
Publisher:PEARSON
The Basic Practice of Statistics
Statistics
ISBN:9781319042578
Author:David S. Moore, William I. Notz, Michael A. Fligner
Publisher:W. H. Freeman
Introduction to the Practice of Statistics
Statistics
ISBN:9781319013387
Author:David S. Moore, George P. McCabe, Bruce A. Craig
Publisher:W. H. Freeman