ENGR.ECONOMIC ANALYSIS
14th Edition
ISBN: 9780190931919
Author: NEWNAN
Publisher: Oxford University Press
expand_more
expand_more
format_list_bulleted
Question

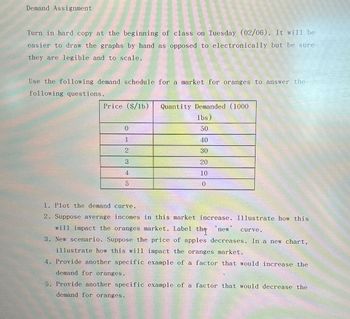
Transcribed Image Text:Demand Assignment
Turn in hard copy at the beginning of class on Tuesday (02/06). It will be
easier to draw the graphs by hand as opposed to electronically but be sure
they are legible and to scale.
Use the following demand schedule for a market for oranges to answer the
following questions.
Price ($/1b) Quantity Demanded (1000
lbs)
50
40
30
20
10
0
0
1
2
3
4
5
1. Plot the demand curve.
2. Suppose average incomes in this market increase. Illustrate how this
will impact the oranges market. Label the 'new' curve.
3. New scenario. Suppose the price of apples decreases. In a new chart,
illustrate how this will impact the oranges market.
4. Provide another specific example of a factor that would increase the
demand for oranges.
5. Provide another specific example of a factor that would decrease the
demand for oranges.
SAVE
AI-Generated Solution
info
AI-generated content may present inaccurate or offensive content that does not represent bartleby’s views.
Unlock instant AI solutions
Tap the button
to generate a solution
to generate a solution
Click the button to generate
a solution
a solution
Knowledge Booster
Similar questions
- Quantity Demanded Price $3.00 $6.00 $9.00 $12.00 $15.00 $18.00 $21.00 $24.00 $27.00 Quantity Supplied 225 200 175 150 125 100 75 50 25 20 40 60 80 100 120 140 160 The demand and supply schedules for hats are above. Plot both in the area below. Find the equilibrium price and quantity.arrow_forwardNote:- Do not provide handwritten solution. Maintain accuracy and quality in your answer. Take care of plagiarism. Answer completely. You will get up vote for sure.arrow_forwardDraw a supply and demand diagram with this information: Please include the The price axis with a label and a scale showing various number The quantity axis with a label and a scale showing various numbers The Supply curve with a label The Demand curve with a label The equilibrium price, also labeled The equilibrium quantity, also labeled information- Product: Sweatshirt Time period: Sweatshirts sold per week. Geographic area: Buckley Range of prices: $0-$25 Quantity Range: 1,000 sweatshirtsarrow_forward
- Explain the impact of higher corn prices on consumers. Draw a graph explaining the impact of higher corn prices on consumers. Explain which curve will shift on your graph and the change in price and quantity demanded. Explain the impact of higher corn prices on producers. Draw a graph explaining the impact of higher corn prices on producers. Explain which curve will shift on your graph and the change in price and quantity supplied.arrow_forwardI need help with 5 and 8arrow_forwardThe following graph displays four demand curves (LL, MM, NN, and 00) that intersect at point A. 200 180 N. 160 M 140 E 120 t. 100 80 60 40 N. 20 20 40 60 80 100 120 140 160 180 200 QUANTITY (Units) A + PRICE (Dollars per unit)arrow_forward
- What is the slope of the given demand curve?arrow_forwardWhat are some general factors that can impact the demand for a product and the supply of a product? Identify at least two factors for each and explain the different ways these determinants can shift supply and demand either left or right.arrow_forwardNonearrow_forward
arrow_back_ios
arrow_forward_ios
Recommended textbooks for you

 Principles of Economics (12th Edition)EconomicsISBN:9780134078779Author:Karl E. Case, Ray C. Fair, Sharon E. OsterPublisher:PEARSON
 Engineering Economy (17th Edition)EconomicsISBN:9780134870069Author:William G. Sullivan, Elin M. Wicks, C. Patrick KoellingPublisher:PEARSON
 Principles of Economics (MindTap Course List)EconomicsISBN:9781305585126Author:N. Gregory MankiwPublisher:Cengage Learning
 Managerial Economics: A Problem Solving ApproachEconomicsISBN:9781337106665Author:Luke M. Froeb, Brian T. McCann, Michael R. Ward, Mike ShorPublisher:Cengage Learning
 Managerial Economics & Business Strategy (Mcgraw-...EconomicsISBN:9781259290619Author:Michael Baye, Jeff PrincePublisher:McGraw-Hill Education


Principles of Economics (12th Edition)
Economics
ISBN:9780134078779
Author:Karl E. Case, Ray C. Fair, Sharon E. Oster
Publisher:PEARSON

Engineering Economy (17th Edition)
Economics
ISBN:9780134870069
Author:William G. Sullivan, Elin M. Wicks, C. Patrick Koelling
Publisher:PEARSON

Principles of Economics (MindTap Course List)
Economics
ISBN:9781305585126
Author:N. Gregory Mankiw
Publisher:Cengage Learning

Managerial Economics: A Problem Solving Approach
Economics
ISBN:9781337106665
Author:Luke M. Froeb, Brian T. McCann, Michael R. Ward, Mike Shor
Publisher:Cengage Learning

Managerial Economics & Business Strategy (Mcgraw-...
Economics
ISBN:9781259290619
Author:Michael Baye, Jeff Prince
Publisher:McGraw-Hill Education