
MATLAB: An Introduction with Applications
6th Edition
ISBN: 9781119256830
Author: Amos Gilat
Publisher: John Wiley & Sons Inc
expand_more
expand_more
format_list_bulleted
Related questions
Question
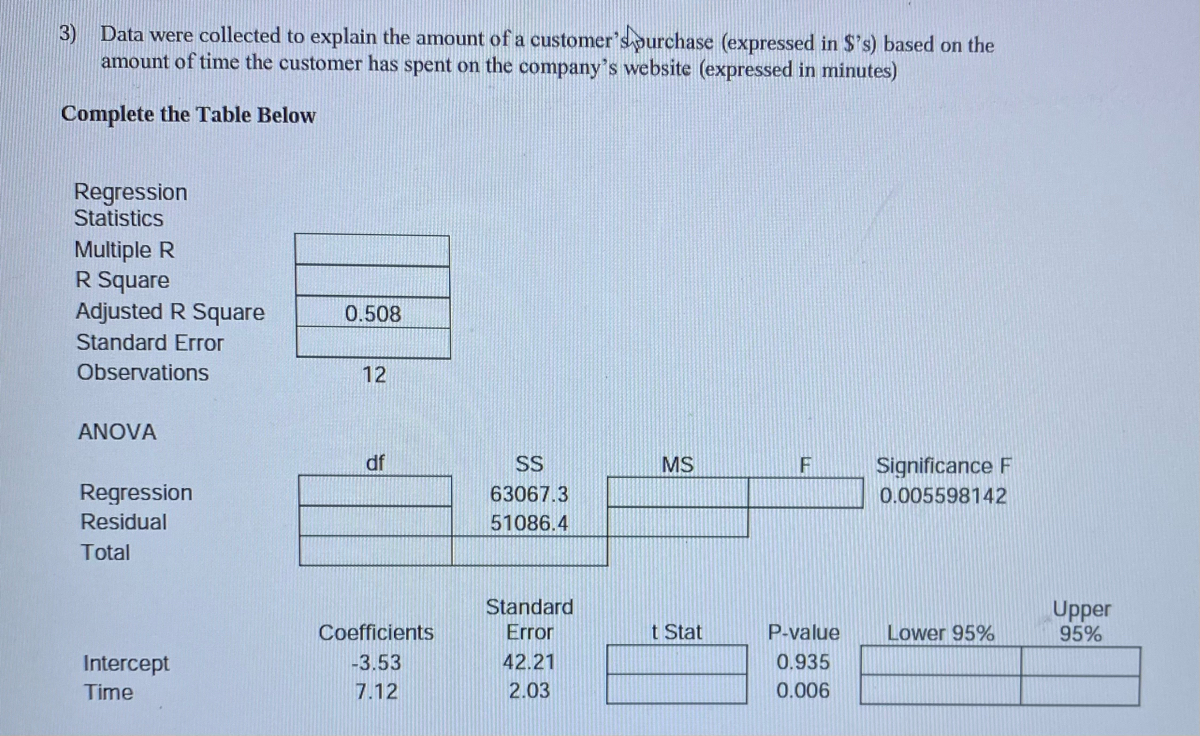
Data were collected to explain the amount of a customer’s purchase (expressed in $’s) based on the amount of time the customer has spent on the company’s website (expressed in minutes)
Based on the regression results, answer the following questions
d) What is the standard error of the error term in the regression equation?
e) Is the coefficient on the variable “time” statistically significantly different than 0 at the 5% level of significance? How do you know?
f) What is the predicted purchase amount for a customer who has spent 30 minutes on the website?

Transcribed Image Text:3)
Data were collected to explain the amount of a customer's ourchase (expressed in $'s) based on the
amount of time the customer has spent on the company's website (expressed in minutes)
Complete the Table Below
Regression
Statistics
Multiple R
R Square
Adjusted R Square
0.508
Standard Error
Observations
12
ANOVA
df
SS
MS
F
Significance F
Regression
63067.3
0.005598142
Residual
51086.4
Total
Standard
Error
Upper
95%
Coefficients
t Stat
P-value
Lower 95%
Intercept
-3.53
42.21
0.935
Time
7.12
2.03
0.006
Expert Solution
This question has been solved!
Explore an expertly crafted, step-by-step solution for a thorough understanding of key concepts.

Step by stepSolved in 2 steps

Knowledge Booster

Similar questions
- The multiple regression describes how the mean value of y is related to the xi independent variables. The parameters ?i are used to describe how the mean value of y changes for a one-unit increase in xi when the other variables are held constant. The given estimated regression equation follows where x1 is the high-school grade point average, x2 is the SAT mathematics score, and y is the final college grade point average. ŷ = −1.38 + 0.0232x1 + 0.00482x2 If the variable x2 is held constant, then only changes in x1 will impact the predicted values of ŷ. Since the coefficient of x1 is positive, for each one-unit increase of x1, the values of ŷ will increase by the value of ?1, where ?1 = . In context, for each one point increase of the high-school grade point average, the final college grade point average will increase by this amount when the SAT mathematics score does not change. If the variable x1 is held constant, then only changes in x2 will impact the predicted values of ŷ. Since the…arrow_forwardIn a regression analysis if SSE = 64 and SSR = 364, then what is the coefficient of determination? (please keep 2 decimal places)arrow_forwardWhat is the regression equation? (Round to decimal one) The best predicted weight of a bear with a chest size 43 inches is how many pounds???? Round to decimal one)arrow_forward
- I need in one hour pls help thankyouarrow_forwardUsing your dataset, run a regression of Y=GPA and X=# Friends.(do not need your actual data, just the regression results)a) State what this regression is attempting to analyze. “By running this regression, we areattempting to show.....”b) Write out the regression equation and describe what it shows (if Friends increase by 1, then. . . ).c) Find your hypothesized GPA when the # friends equals 17.d) Is the slope of # of Friends significantly different from zero?Include Ho, Ha, decision rule, t statistic from table, tc, decision, and conclusion.e) Is the r-squared of # of Friends significantly different from zero?Include Ho, Ha, decision rule, F statistic from table, Fc, decision, and conclusion.arrow_forwardAn automobile rental company wants to predict the yearly maintenance expense (Y) for an automobile using the number of miles driven during the year () and the age of the car (, in years) at the beginning of the year. The company has gathered the data on 10 automobiles and run a regression analysis with the results shown below:. Summary measures Multiple R 0.9689 R-Square 0.9387 Adj R-Square 0.9212 StErr of Estimate 72.218 Regression coefficients Coefficient Std Err t-value p-value Constant 33.796 48.181 0.7014 0.5057 Miles Driven 0.0549 0.0191 2.8666 0.0241 Age of car 21.467 20.573 1.0434 0.3314 Use the information above to estimate the annual maintenance expense for a 10 years old car with 60,000 miles.arrow_forward
- Suppose the following estimated regression equation was determined to predict salary based on years of experience. Estimated Salary = 29,136.63 +2257.51(Years of Experience) What is the estimated salary for an employee with 24 years of experience? Answer Keypad Keyboard Shortcuts Tablesarrow_forwardi submitted a picture of the questionarrow_forwardplease answer the third and fourth partarrow_forward
- 4)arrow_forwardA regression was run to determine if there is a relationship between hours of study per week (xx) and the final exam scores (yy).The results of the regression were: y=ax+b a=5.614 b=32.79 r2=0.808201 r=0.899 Use this to predict the final exam score of a student who studies 1 hours per week, and please round your answer to a whole number.arrow_forward
arrow_back_ios
arrow_forward_ios
Recommended textbooks for you
- MATLAB: An Introduction with ApplicationsStatisticsISBN:9781119256830Author:Amos GilatPublisher:John Wiley & Sons Inc
 Probability and Statistics for Engineering and th...StatisticsISBN:9781305251809Author:Jay L. DevorePublisher:Cengage Learning
 Statistics for The Behavioral Sciences (MindTap C...StatisticsISBN:9781305504912Author:Frederick J Gravetter, Larry B. WallnauPublisher:Cengage Learning
  Elementary Statistics: Picturing the World (7th E...StatisticsISBN:9780134683416Author:Ron Larson, Betsy FarberPublisher:PEARSON
 The Basic Practice of StatisticsStatisticsISBN:9781319042578Author:David S. Moore, William I. Notz, Michael A. FlignerPublisher:W. H. Freeman
 Introduction to the Practice of StatisticsStatisticsISBN:9781319013387Author:David S. Moore, George P. McCabe, Bruce A. CraigPublisher:W. H. Freeman
MATLAB: An Introduction with Applications
Statistics
ISBN:9781119256830
Author:Amos Gilat
Publisher:John Wiley & Sons Inc
Probability and Statistics for Engineering and th...
Statistics
ISBN:9781305251809
Author:Jay L. Devore
Publisher:Cengage Learning
Statistics for The Behavioral Sciences (MindTap C...
Statistics
ISBN:9781305504912
Author:Frederick J Gravetter, Larry B. Wallnau
Publisher:Cengage Learning
Elementary Statistics: Picturing the World (7th E...
Statistics
ISBN:9780134683416
Author:Ron Larson, Betsy Farber
Publisher:PEARSON
The Basic Practice of Statistics
Statistics
ISBN:9781319042578
Author:David S. Moore, William I. Notz, Michael A. Fligner
Publisher:W. H. Freeman
Introduction to the Practice of Statistics
Statistics
ISBN:9781319013387
Author:David S. Moore, George P. McCabe, Bruce A. Craig
Publisher:W. H. Freeman