
MATLAB: An Introduction with Applications
6th Edition
ISBN: 9781119256830
Author: Amos Gilat
Publisher: John Wiley & Sons Inc
expand_more
expand_more
format_list_bulleted
Related questions
Question
thumb_up100%
Parts a through d please, thank you!
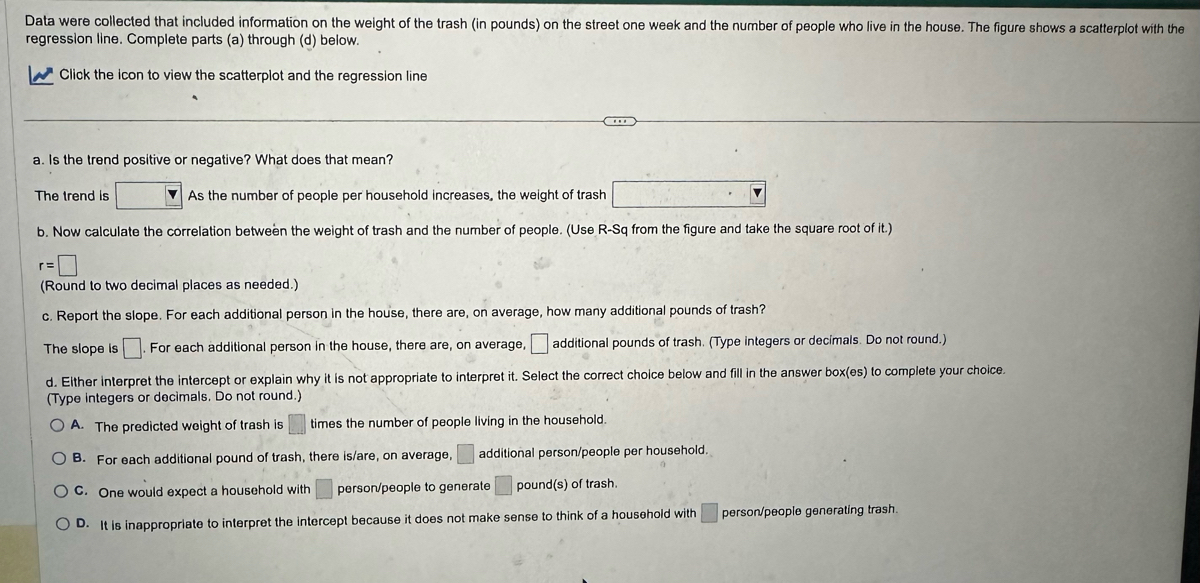

Transcribed Image Text:Data were collected that included information on the weight of the trash (in pounds) on the street one week and the number of people who live in the house. The figure shows a scatterplot with the
regression line. Complete parts (a) through (d) below.
Click the icon to view the scatterplot and the regression line
a. Is the trend positive or negative? What does that mean?
The trend is
As the number of people per household increases, the weight of trash
b. Now calculate the correlation between the weight of trash and the number of people. (Use R-Sq from the figure and take the square root of it.)
r=
(Round to two decimal places as needed.).
c. Report the slope. For each additional person in the house, there are, on average, how many additional pounds of trash?
The slope is
For each additional person in the house, there are, on average,
additional pounds of trash. (Type integers or decimals. Do not round.)
d. Either interpret the intercept or explain why it is not appropriate to interpret it. Select the correct choice below and fill in the answer box(es) to complete your choice.
(Type integers or decimals. Do not round.)
OA. The predicted weight of trash is
times the number of people living in the household.
OB. For each additional pound of trash, there is/are, on average,
additional person/people per household.
OC. One would expect a household with
person/people to generate
pound(s) of trash.
OD. It is inappropriate to interpret the intercept because it does not make sense to think of a household with
person/people generating trash.

Transcribed Image Text:Scatterplot and Regression Line
Trash (pounds)
Predicted Trash = 2.630 + 11.16 People
100-
80-
R-sq = 76.8%
60-
40-
20-
0
1
2
3
People per Household
-
Expert Solution
This question has been solved!
Explore an expertly crafted, step-by-step solution for a thorough understanding of key concepts.

Step by stepSolved in 2 steps

Knowledge Booster

Similar questions
arrow_back_ios
SEE MORE QUESTIONS
arrow_forward_ios
Recommended textbooks for you
- MATLAB: An Introduction with ApplicationsStatisticsISBN:9781119256830Author:Amos GilatPublisher:John Wiley & Sons Inc
 Probability and Statistics for Engineering and th...StatisticsISBN:9781305251809Author:Jay L. DevorePublisher:Cengage Learning
 Statistics for The Behavioral Sciences (MindTap C...StatisticsISBN:9781305504912Author:Frederick J Gravetter, Larry B. WallnauPublisher:Cengage Learning
  Elementary Statistics: Picturing the World (7th E...StatisticsISBN:9780134683416Author:Ron Larson, Betsy FarberPublisher:PEARSON
 The Basic Practice of StatisticsStatisticsISBN:9781319042578Author:David S. Moore, William I. Notz, Michael A. FlignerPublisher:W. H. Freeman
 Introduction to the Practice of StatisticsStatisticsISBN:9781319013387Author:David S. Moore, George P. McCabe, Bruce A. CraigPublisher:W. H. Freeman
MATLAB: An Introduction with Applications
Statistics
ISBN:9781119256830
Author:Amos Gilat
Publisher:John Wiley & Sons Inc
Probability and Statistics for Engineering and th...
Statistics
ISBN:9781305251809
Author:Jay L. Devore
Publisher:Cengage Learning
Statistics for The Behavioral Sciences (MindTap C...
Statistics
ISBN:9781305504912
Author:Frederick J Gravetter, Larry B. Wallnau
Publisher:Cengage Learning
Elementary Statistics: Picturing the World (7th E...
Statistics
ISBN:9780134683416
Author:Ron Larson, Betsy Farber
Publisher:PEARSON
The Basic Practice of Statistics
Statistics
ISBN:9781319042578
Author:David S. Moore, William I. Notz, Michael A. Fligner
Publisher:W. H. Freeman
Introduction to the Practice of Statistics
Statistics
ISBN:9781319013387
Author:David S. Moore, George P. McCabe, Bruce A. Craig
Publisher:W. H. Freeman