
MATLAB: An Introduction with Applications
6th Edition
ISBN: 9781119256830
Author: Amos Gilat
Publisher: John Wiley & Sons Inc
expand_more
expand_more
format_list_bulleted
Related questions
Question
thumb_up100%
(b)

Transcribed Image Text:**Data Table**
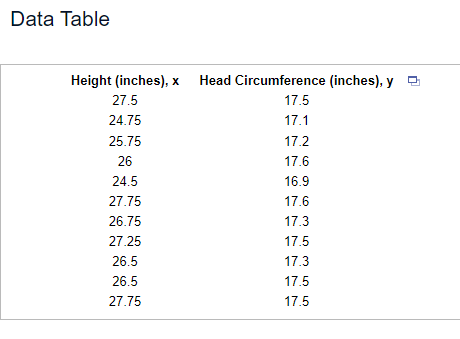
| Height (inches), x | Head Circumference (inches), y |
|--------------------|--------------------------------|
| 27.5 | 17.5 |
| 24.75 | 17.1 |
| 25.75 | 17.2 |
| 26 | 17.6 |
| 24.5 | 16.9 |
| 27.75 | 17.6 |
| 27.25 | 17.3 |
| 26.75 | 17.5 |
| 26.5 | 17.3 |
| 26.5 | 17.5 |
| 27.75 | 17.5 |
This table displays the relationship between height (in inches) and head circumference (in inches). Each row represents a set of measurements for a specific individual or observation. The first column lists the height values, while the second column provides the corresponding head circumference measurements. These data points can be used for analysis or educational purposes, such as understanding correlations or patterns in physical growth.
![A pediatrician wants to determine the relationship between a child's height, \( x \), and head circumference, \( y \). She randomly selects 11 children from her practice, measures their heights and head circumferences, and obtains the accompanying data. Complete parts (a) through (g) below.
(a) Find the least-squares regression line treating height as the explanatory variable and head circumference as the response variable.
\[
\hat{y} = 0.165x + 13
\]
(Round the slope to three decimal places and round the constant to one decimal place as needed.)
(b) Interpret the slope and y-intercept, if appropriate.
First, interpret the slope. Select the correct choice below and, if necessary, fill in the answer box to complete your choice.
- A. For every inch increase in head circumference, the height increases by \(\_\_\_\) in., on average. (Round to three decimal places as needed.)
- B. For a height of 0 inches, the head circumference is predicted to be \(\_\_\_\) in. (Round to three decimal places as needed.)
- C. For a head circumference of 0 inches, the height is predicted to be \(\_\_\_\) in. (Round to three decimal places as needed.)
- D. For every inch increase in height, the head circumference increases by \(\_\_\_\) in., on average. (Round to three decimal places as needed.)](https://content.bartleby.com/qna-images/question/4b16ece0-c783-4798-b8b6-3ccb9c1c7a2c/bd59b974-c81f-4426-b068-c252ee2d7e2e/2jl0f3h_processed.png)
Transcribed Image Text:A pediatrician wants to determine the relationship between a child's height, \( x \), and head circumference, \( y \). She randomly selects 11 children from her practice, measures their heights and head circumferences, and obtains the accompanying data. Complete parts (a) through (g) below.
(a) Find the least-squares regression line treating height as the explanatory variable and head circumference as the response variable.
\[
\hat{y} = 0.165x + 13
\]
(Round the slope to three decimal places and round the constant to one decimal place as needed.)
(b) Interpret the slope and y-intercept, if appropriate.
First, interpret the slope. Select the correct choice below and, if necessary, fill in the answer box to complete your choice.
- A. For every inch increase in head circumference, the height increases by \(\_\_\_\) in., on average. (Round to three decimal places as needed.)
- B. For a height of 0 inches, the head circumference is predicted to be \(\_\_\_\) in. (Round to three decimal places as needed.)
- C. For a head circumference of 0 inches, the height is predicted to be \(\_\_\_\) in. (Round to three decimal places as needed.)
- D. For every inch increase in height, the head circumference increases by \(\_\_\_\) in., on average. (Round to three decimal places as needed.)
Expert Solution
This question has been solved!
Explore an expertly crafted, step-by-step solution for a thorough understanding of key concepts.

Step by stepSolved in 2 steps with 1 images

Knowledge Booster

Similar questions
- C and Darrow_forward6arrow_forwardAllergic reactions to poison ivy can be miserable. Plant oils cause the reaction. Researchers at Allergy Institute did a study to determine the effects of washing the oil off within 5 minutes of exposure. A random sample of 1000 people with known allergies to poison ivy participated in the study. Oil from the poison ivy plant was rubbed on a patch of skin. For 500 of the subjects, it was washed off within 5 minutes. For the other 500 subjects, the oil was washed off after 5 minutes. The results are summarized in the following table. Reaction None Mild Strong Column Total Within 5 Minutes After 5 Minutes 391 65 44 500 66 341 93 500 Row Total 457 406 137 1000 Let's use the following notation for the various events: W= washing oil off within 5 minutes, A = washing oil off after 5 minutes, N = no reaction, M = mild reaction, S = strong reaction. Find the following probabilities for a person selected at random from this sample of 1000 subjects. (Use 3 decimal places.)arrow_forward
arrow_back_ios
arrow_forward_ios
Recommended textbooks for you
- MATLAB: An Introduction with ApplicationsStatisticsISBN:9781119256830Author:Amos GilatPublisher:John Wiley & Sons Inc
 Probability and Statistics for Engineering and th...StatisticsISBN:9781305251809Author:Jay L. DevorePublisher:Cengage Learning
 Statistics for The Behavioral Sciences (MindTap C...StatisticsISBN:9781305504912Author:Frederick J Gravetter, Larry B. WallnauPublisher:Cengage Learning
  Elementary Statistics: Picturing the World (7th E...StatisticsISBN:9780134683416Author:Ron Larson, Betsy FarberPublisher:PEARSON
 The Basic Practice of StatisticsStatisticsISBN:9781319042578Author:David S. Moore, William I. Notz, Michael A. FlignerPublisher:W. H. Freeman
 Introduction to the Practice of StatisticsStatisticsISBN:9781319013387Author:David S. Moore, George P. McCabe, Bruce A. CraigPublisher:W. H. Freeman
MATLAB: An Introduction with Applications
Statistics
ISBN:9781119256830
Author:Amos Gilat
Publisher:John Wiley & Sons Inc
Probability and Statistics for Engineering and th...
Statistics
ISBN:9781305251809
Author:Jay L. Devore
Publisher:Cengage Learning
Statistics for The Behavioral Sciences (MindTap C...
Statistics
ISBN:9781305504912
Author:Frederick J Gravetter, Larry B. Wallnau
Publisher:Cengage Learning
Elementary Statistics: Picturing the World (7th E...
Statistics
ISBN:9780134683416
Author:Ron Larson, Betsy Farber
Publisher:PEARSON
The Basic Practice of Statistics
Statistics
ISBN:9781319042578
Author:David S. Moore, William I. Notz, Michael A. Fligner
Publisher:W. H. Freeman
Introduction to the Practice of Statistics
Statistics
ISBN:9781319013387
Author:David S. Moore, George P. McCabe, Bruce A. Craig
Publisher:W. H. Freeman