MATLAB: An Introduction with Applications
6th Edition
ISBN: 9781119256830
Author: Amos Gilat
Publisher: John Wiley & Sons Inc
expand_more
expand_more
format_list_bulleted
Question
d, e, and f

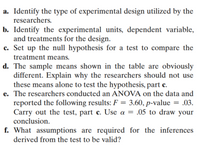
Transcribed Image Text:a. Identify the type of experimental design utilized by the
researchers.
b. Identify the experimental units, dependent variable,
and treatments for the design.
c. Set up the null hypothesis for a test to compare the
treatment means.
d. The sample means shown in the table are obviously
different. Explain why the researchers should not use
these means alone to test the hypothesis, part c.
e. The researchers conducted an ANOVA on the data and
reported the following results: F = 3.60, p-value = .03.
Carry out the test, part c. Use a = .05 to draw your
conclusion.
f. What assumptions are required for the inferences
derived from the test to be valid?

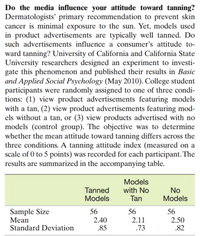
Transcribed Image Text:Do the media influence your attitude toward tanning?
Dermatologists' primary recommendation to prevent skin
cancer is minimal exposure to the sun. Yet, models used
in product advertisements are typically well tanned. Do
such advertisements influence a consumer's attitude to-
ward tanning? University of California and California State
University researchers designed an experiment to investi-
gate this phenomenon and published their results in Basic
and Applied Social Psychology (May 2010). College student
participants were randomly assigned to one of three condi-
tions: (1) view product advertisements featuring models
with a tan, (2) view product advertisements featuring mod-
els without a tan, or (3) view products advertised with no
models (control group). The objective was to determine
whether the mean attitude toward tanning differs across the
three conditions. A tanning attitude index (measured on a
scale of 0 to 5 points) was recorded for each participant. The
results are summarized in the accompanying table.
Models
Tanned
Models
with No
Tan
No
Models
Sample Size
Mean
Standard Deviation
56
56
56
2.40
.85
2.50
.82
2.11
.73
Expert Solution
This question has been solved!
Explore an expertly crafted, step-by-step solution for a thorough understanding of key concepts.
This is a popular solution
Trending nowThis is a popular solution!
Step by stepSolved in 2 steps

Knowledge Booster
Similar questions
- An independent variable that makes a unique contribution to the prediction of a dependent variable is a(n) ______ variable. a. manifest b. orthogonal c. unique d. latentarrow_forwardTime is generally thought of as the dependant variable. O True Falsearrow_forwarddeterminr the range and standard deviation of the set of data 4,8,9,11,13,15arrow_forward
- Answer the following 1. {(10,9), (-2, -16), (-6,7), (5,8), (8,-16), (-11,9)}Domain: ___________________________Range: ____________________________Function or Not: _____________________ 2. {(15,-3), (-6,9), (-3,0), (-1,16)}Domain: ___________________________Range: ____________________________Function or Not: _____________________ 3.{(-4,3), (5,-9), (11,4), (9,6), (5,-3), (8,-9), (1,4)}Domain: ___________________________Range: ____________________________Function or Not: _____________________ 4. {(6,0),(-12,-16),(-6,10),(20,-7)} Domain: ___________________________Range: ____________________________Function or Not: _____________________arrow_forwardHow much did Patricia earn last weekarrow_forward
arrow_back_ios
arrow_forward_ios
Recommended textbooks for you
 MATLAB: An Introduction with ApplicationsStatisticsISBN:9781119256830Author:Amos GilatPublisher:John Wiley & Sons Inc
 Probability and Statistics for Engineering and th...StatisticsISBN:9781305251809Author:Jay L. DevorePublisher:Cengage Learning
 Statistics for The Behavioral Sciences (MindTap C...StatisticsISBN:9781305504912Author:Frederick J Gravetter, Larry B. WallnauPublisher:Cengage Learning
 Elementary Statistics: Picturing the World (7th E...StatisticsISBN:9780134683416Author:Ron Larson, Betsy FarberPublisher:PEARSON
 The Basic Practice of StatisticsStatisticsISBN:9781319042578Author:David S. Moore, William I. Notz, Michael A. FlignerPublisher:W. H. Freeman
 Introduction to the Practice of StatisticsStatisticsISBN:9781319013387Author:David S. Moore, George P. McCabe, Bruce A. CraigPublisher:W. H. Freeman

MATLAB: An Introduction with Applications
Statistics
ISBN:9781119256830
Author:Amos Gilat
Publisher:John Wiley & Sons Inc

Probability and Statistics for Engineering and th...
Statistics
ISBN:9781305251809
Author:Jay L. Devore
Publisher:Cengage Learning

Statistics for The Behavioral Sciences (MindTap C...
Statistics
ISBN:9781305504912
Author:Frederick J Gravetter, Larry B. Wallnau
Publisher:Cengage Learning

Elementary Statistics: Picturing the World (7th E...
Statistics
ISBN:9780134683416
Author:Ron Larson, Betsy Farber
Publisher:PEARSON

The Basic Practice of Statistics
Statistics
ISBN:9781319042578
Author:David S. Moore, William I. Notz, Michael A. Fligner
Publisher:W. H. Freeman

Introduction to the Practice of Statistics
Statistics
ISBN:9781319013387
Author:David S. Moore, George P. McCabe, Bruce A. Craig
Publisher:W. H. Freeman