
MATLAB: An Introduction with Applications
6th Edition
ISBN: 9781119256830
Author: Amos Gilat
Publisher: John Wiley & Sons Inc
expand_more
expand_more
format_list_bulleted
Related questions
Question
Just D-I please
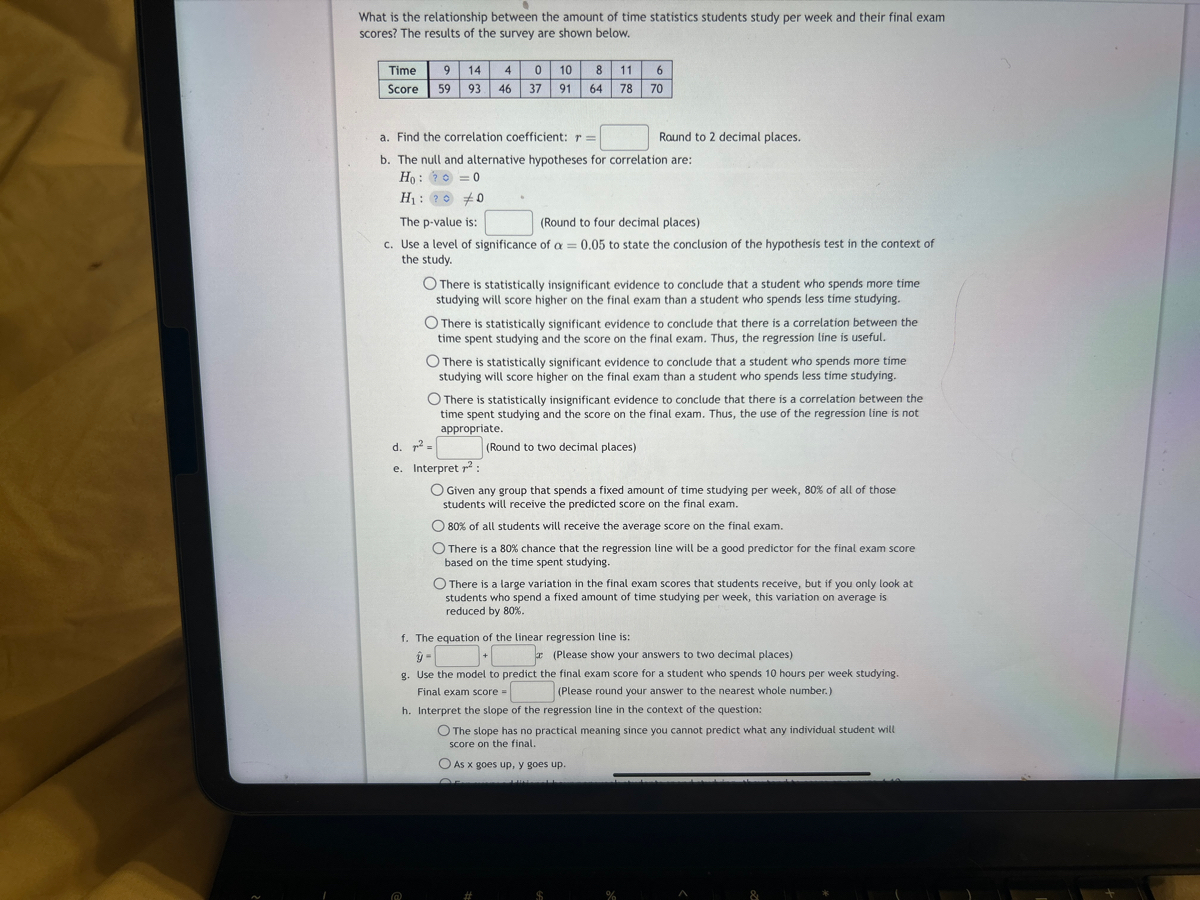

Transcribed Image Text:What is the relationship between the amount of time statistics students study per week and their final exam
scores? The results of the survey are shown below.
Time 9 14 4
Score 59 93 46
0
37
10 8 11 6
91
64 78 70
a. Find the correlation coefficient: r =
b. The null and alternative hypotheses for correlation are:
Ho:?=0
H₁: ?00
The p-value is:
(Round to four decimal places)
c. Use a level of significance of a = 0.05 to state the conclusion of the hypothesis test in the context of
the study.
O There is statistically insignificant evidence to conclude that a student who spends more time
studying will score higher on the final exam than a student who spends less time studying.
Round to 2 decimal places.
O There is statistically significant evidence to conclude that there is a correlation between the
time spent studying and the score on the final exam. Thus, the regression line is useful.
d. ² =
e. Interpret ²:
O There is statistically significant evidence to conclude that a student who spends more time
studying will score higher on the final exam than a student who spends less time studying.
O There is statistically insignificant evidence to conclude that there is a correlation between the
time spent studying and the score on the final exam. Thus, the use of the regression line is not
appropriate.
(Round to two decimal places)
Given any group that spends a fixed amount of time studying per week, 80% of all of those
students will receive the predicted score on the final exam.
O 80% of all students will receive the average score on the final exam.
O There is a 80% chance that the regression line will be a good predictor for the final exam score
based on the time spent studying.
O There is a large variation in the final exam scores that students receive, but if you only look at
students who spend a fixed amount of time studying per week, this variation on average is
reduced by 80%.
f. The equation of the linear regression line is:
+
(Please show your answers to two decimal places)
g. Use the model to predict the final exam score for a student who spends 10 hours per week studying.
Final exam score =
(Please round your answer to the nearest whole number.)
h. Interpret the slope of the regression line in the context of the question:
O The slope has no practical meaning since you cannot predict what any individual student will
score on the final.
O As x goes up, y goes up.
JALA
%
A
&
![app
d. 72 =
e. Interpret 7²:
O Given any group that spends a fixed amount of time studying per week, 80% of all of those
students will receive the predicted score on the final exam.
O 80% of all students will receive the average score on the final exam.
There is a 80% chance that the regression line will be a good predictor for the final exam score
based on the time spent studying.
(Round to two decimal places)
O There is a large variation in the final exam scores that students receive, but if you only look at
students who spend a fixed amount of time studying per week, this variation on average is
reduced by 80%.
f. The equation of the linear regression line is:
(Please show your answers to two decimal places)
g. Use the model to predict the final exam score for a student who spends 10 hours per week studying.
Final exam score =
(Please round your answer to the nearest whole number.)
h. Interpret the slope of the regression line in the context of the question:
O The slope has no practical meaning since you cannot predict what any individual student will
score on the final.
O As x goes up, y goes up.
O For every additional hour per week students spend studying, they tend to score on averge 4.10
higher on the final exam.
i. Interpret the y-intercept in the context of the question:
O If a student does not study at all, then that student will score 35 on the final exam.
The average final exam score is predicted to be 35.
The best prediction for a student who doesn't study at all is that the student will score 35 on the
final exam.
O The y-intercept has no practical meaning for this study.
Hint: Helpful Video on the Linear Regression Line [+]](https://content.bartleby.com/qna-images/question/998c0d1a-ff65-42b1-8215-acf4aa1ab8d8/72dfcbf3-417f-44a5-9f81-b00c49125bae/rjb72h_processed.jpeg)
Transcribed Image Text:app
d. 72 =
e. Interpret 7²:
O Given any group that spends a fixed amount of time studying per week, 80% of all of those
students will receive the predicted score on the final exam.
O 80% of all students will receive the average score on the final exam.
There is a 80% chance that the regression line will be a good predictor for the final exam score
based on the time spent studying.
(Round to two decimal places)
O There is a large variation in the final exam scores that students receive, but if you only look at
students who spend a fixed amount of time studying per week, this variation on average is
reduced by 80%.
f. The equation of the linear regression line is:
(Please show your answers to two decimal places)
g. Use the model to predict the final exam score for a student who spends 10 hours per week studying.
Final exam score =
(Please round your answer to the nearest whole number.)
h. Interpret the slope of the regression line in the context of the question:
O The slope has no practical meaning since you cannot predict what any individual student will
score on the final.
O As x goes up, y goes up.
O For every additional hour per week students spend studying, they tend to score on averge 4.10
higher on the final exam.
i. Interpret the y-intercept in the context of the question:
O If a student does not study at all, then that student will score 35 on the final exam.
The average final exam score is predicted to be 35.
The best prediction for a student who doesn't study at all is that the student will score 35 on the
final exam.
O The y-intercept has no practical meaning for this study.
Hint: Helpful Video on the Linear Regression Line [+]
Expert Solution
This question has been solved!
Explore an expertly crafted, step-by-step solution for a thorough understanding of key concepts.

Step by stepSolved in 5 steps with 3 images

Knowledge Booster

Similar questions
Recommended textbooks for you
- MATLAB: An Introduction with ApplicationsStatisticsISBN:9781119256830Author:Amos GilatPublisher:John Wiley & Sons Inc
 Probability and Statistics for Engineering and th...StatisticsISBN:9781305251809Author:Jay L. DevorePublisher:Cengage Learning
 Statistics for The Behavioral Sciences (MindTap C...StatisticsISBN:9781305504912Author:Frederick J Gravetter, Larry B. WallnauPublisher:Cengage Learning
  Elementary Statistics: Picturing the World (7th E...StatisticsISBN:9780134683416Author:Ron Larson, Betsy FarberPublisher:PEARSON
 The Basic Practice of StatisticsStatisticsISBN:9781319042578Author:David S. Moore, William I. Notz, Michael A. FlignerPublisher:W. H. Freeman
 Introduction to the Practice of StatisticsStatisticsISBN:9781319013387Author:David S. Moore, George P. McCabe, Bruce A. CraigPublisher:W. H. Freeman
MATLAB: An Introduction with Applications
Statistics
ISBN:9781119256830
Author:Amos Gilat
Publisher:John Wiley & Sons Inc
Probability and Statistics for Engineering and th...
Statistics
ISBN:9781305251809
Author:Jay L. Devore
Publisher:Cengage Learning
Statistics for The Behavioral Sciences (MindTap C...
Statistics
ISBN:9781305504912
Author:Frederick J Gravetter, Larry B. Wallnau
Publisher:Cengage Learning
Elementary Statistics: Picturing the World (7th E...
Statistics
ISBN:9780134683416
Author:Ron Larson, Betsy Farber
Publisher:PEARSON
The Basic Practice of Statistics
Statistics
ISBN:9781319042578
Author:David S. Moore, William I. Notz, Michael A. Fligner
Publisher:W. H. Freeman
Introduction to the Practice of Statistics
Statistics
ISBN:9781319013387
Author:David S. Moore, George P. McCabe, Bruce A. Craig
Publisher:W. H. Freeman