MATLAB: An Introduction with Applications
6th Edition
ISBN: 9781119256830
Author: Amos Gilat
Publisher: John Wiley & Sons Inc
expand_more
expand_more
format_list_bulleted
Question

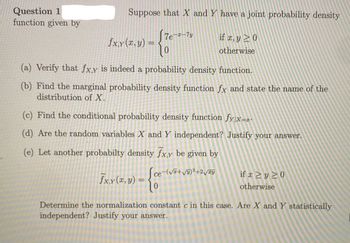
Transcribed Image Text:Question 1
function given by
Suppose that X and Y have a joint probability density
if x, y ≥ 0
otherwise
fx,y(x, y) =
(a) Verify that fx,y is indeed a probability density function.
(b) Find the marginal probability density function fx and state the name of the
distribution of X.
7e-x-7y
(c) Find the conditional probability density function fy|x=x-
(d) Are the random variables X and Y independent? Justify your answer.
(e) Let another probabilty density fx,y be given by
Sce-(√+√y)²+2√y
- {e
fx.y (x, y) =
if x ≥ y ≥0
otherwise
Determine the normalization constant c in this case. Are X and Y statistically
independent? Justify your answer.
Expert Solution
This question has been solved!
Explore an expertly crafted, step-by-step solution for a thorough understanding of key concepts.
Step by stepSolved in 4 steps with 3 images

Follow-up Questions
Read through expert solutions to related follow-up questions below.
Follow-up Question
Can you please attempt part d and e

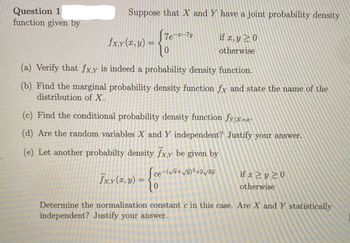
Transcribed Image Text:Question 1
function given by
Suppose that X and Y have a joint probability density
if x, y ≥ 0
otherwise
fx,y(x, y) =
(a) Verify that fx,y is indeed a probability density function.
(b) Find the marginal probability density function fx and state the name of the
distribution of X.
7e-x-7y
(c) Find the conditional probability density function fy|x=x-
(d) Are the random variables X and Y independent? Justify your answer.
(e) Let another probabilty density fx,y be given by
Sce-(√+√y)²+2√y
- {e
fx.y (x, y) =
if x ≥ y ≥0
otherwise
Determine the normalization constant c in this case. Are X and Y statistically
independent? Justify your answer.
Solution
by Bartleby Expert
Follow-up Questions
Read through expert solutions to related follow-up questions below.
Follow-up Question
Can you please attempt part d and e

Transcribed Image Text:Question 1
function given by
Suppose that X and Y have a joint probability density
if x, y ≥ 0
otherwise
fx,y(x, y) =
(a) Verify that fx,y is indeed a probability density function.
(b) Find the marginal probability density function fx and state the name of the
distribution of X.
7e-x-7y
(c) Find the conditional probability density function fy|x=x-
(d) Are the random variables X and Y independent? Justify your answer.
(e) Let another probabilty density fx,y be given by
Sce-(√+√y)²+2√y
- {e
fx.y (x, y) =
if x ≥ y ≥0
otherwise
Determine the normalization constant c in this case. Are X and Y statistically
independent? Justify your answer.
Solution
by Bartleby Expert
Knowledge Booster
Similar questions
- Since height is a continuous numerical variable, its probability density function is represented by the smooth curve below. What is true about the area under the curve? 140 160 180 200 height (cm) The area does not represent all possible heights, so the area under the curve and probability are both 0. O The area does not represent all possible heights, so the area above the curve is 1. O The area represents all possibile heights, so the area and probability are both 100. The area represents all possible heights, so the area under the curve and probability of all the height occurring are both 1.arrow_forwardAt a restaurant, the density function for the time a customer has to wait before being seated is given by f(t) = 2e¯ if t > 0. Find the probability that a customer will have to wait at least 6 minutes for a table. Probability = .000006 -2tarrow_forward(c) At a bus stop, there are two buses available (bus numbers 1 and 2). For i = 1,2, the waiting time until bus i arrives is denoted by T;, with T independent of T2, and T; has density function fr. (t) = X, exp(-1;t), t>0.arrow_forward
- The probability density functionarrow_forwardLet X be a random variable with the probability density function f(x) = { ae; x>0 0 ; otherwise Find (i) Value of aarrow_forwardThe random-number generator on calculators randomly generates a number between 0 and 1. The random variable X, the number generated, follows a uniform probability distribution. (a) Identify the graph of the uniform density function. (b) What is the probability of generating a number between 0.48 and 0.62? (c) What is the probability of generating a number greater than 0.85? (a) Choose the correct graph of the uniform density function below. O A. O B. Density 1.2- 1- 0.8- 6. 0.6- 0 0.2 0.4 0.6 0.8 11.2 0.4- 0.2- to (b) The probability is (c) The probability is Q M (Simplify your answer.) (Simplify your answer.) ADensity 1.2- 1- 0.8- 0.6- 0.4- 0.2- to 0 0.2 0.4 0.6 0.8 1 1.2 Q M O C. 1.2- 1- 0.8- 0.6- 0.4- 0.2- Density 0+ 0 0.2 0.4 0.6 0.8 1 12 Q Qarrow_forward
arrow_back_ios
arrow_forward_ios
Recommended textbooks for you
 MATLAB: An Introduction with ApplicationsStatisticsISBN:9781119256830Author:Amos GilatPublisher:John Wiley & Sons Inc
 Probability and Statistics for Engineering and th...StatisticsISBN:9781305251809Author:Jay L. DevorePublisher:Cengage Learning
 Statistics for The Behavioral Sciences (MindTap C...StatisticsISBN:9781305504912Author:Frederick J Gravetter, Larry B. WallnauPublisher:Cengage Learning
 Elementary Statistics: Picturing the World (7th E...StatisticsISBN:9780134683416Author:Ron Larson, Betsy FarberPublisher:PEARSON
 The Basic Practice of StatisticsStatisticsISBN:9781319042578Author:David S. Moore, William I. Notz, Michael A. FlignerPublisher:W. H. Freeman
 Introduction to the Practice of StatisticsStatisticsISBN:9781319013387Author:David S. Moore, George P. McCabe, Bruce A. CraigPublisher:W. H. Freeman

MATLAB: An Introduction with Applications
Statistics
ISBN:9781119256830
Author:Amos Gilat
Publisher:John Wiley & Sons Inc

Probability and Statistics for Engineering and th...
Statistics
ISBN:9781305251809
Author:Jay L. Devore
Publisher:Cengage Learning

Statistics for The Behavioral Sciences (MindTap C...
Statistics
ISBN:9781305504912
Author:Frederick J Gravetter, Larry B. Wallnau
Publisher:Cengage Learning

Elementary Statistics: Picturing the World (7th E...
Statistics
ISBN:9780134683416
Author:Ron Larson, Betsy Farber
Publisher:PEARSON

The Basic Practice of Statistics
Statistics
ISBN:9781319042578
Author:David S. Moore, William I. Notz, Michael A. Fligner
Publisher:W. H. Freeman

Introduction to the Practice of Statistics
Statistics
ISBN:9781319013387
Author:David S. Moore, George P. McCabe, Bruce A. Craig
Publisher:W. H. Freeman