
MATLAB: An Introduction with Applications
6th Edition
ISBN: 9781119256830
Author: Amos Gilat
Publisher: John Wiley & Sons Inc
expand_more
expand_more
format_list_bulleted
Related questions
Question
what is the regression eruation that describes the relationship bewteen the customer's age at death and their father's age at death
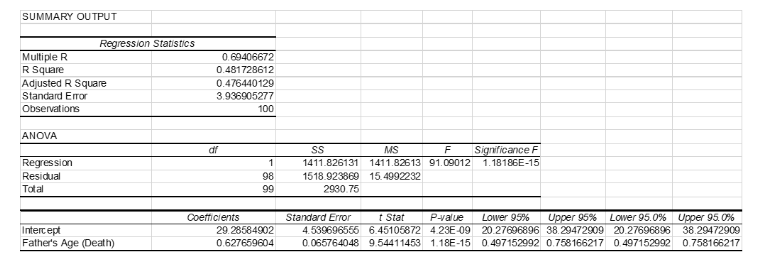

Transcribed Image Text:SUMMARY OUTPUT
Regression Statistics
Multiple R
0.69406672
R Square
Adjusted R Square
Standard Error
Observations
0.481728612
0.476440129
3.936905277
100
ANOVA
Regression
Residual
Total
df
SS
MS
F
1
1411.826131
1411.82613 91.09012
Significance F
1.18186E-15
98
99
1518.923869
2930.75
15.4992232
Coefficients
Standard Error
Intercept
Father's Age (Death)
29.28584902
0.627659604
4.539696555
t Stat P-value
6.45105872 4.23E-09
0.065764048 9.54411453 1.18E-15
Lower 95% Upper 95%
20.27696896 38.29472909
0.497152992 0.758166217
Lower 95.0% Upper 95.0%
20.27696896
0.497152992
38.29472909
0.758166217

Transcribed Image Text:Customer's Age (Death)
Excel was used to run a simple linear regression analysis. Excel output and diagnostic
plots follow for your reference in answering the remaining questions.
15
Father's Age (Death) Residual Plot
Residuals
-10
-15
10
10
5
0
40
50
80
90
100
Father's Age (Death)
100
90
80
Normal Probability Plot
70
50
40
30
20
10
0
0
20
40
60
80
100
120
Sample Percentile
SAVE
AI-Generated Solution
info
AI-generated content may present inaccurate or offensive content that does not represent bartleby’s views.
Unlock instant AI solutions
Tap the button
to generate a solution
to generate a solution
Click the button to generate
a solution
a solution
Knowledge Booster

Similar questions
- Develop a scatterplot and explore the correlation between customer age and net sales by each type of customer (regular/promotion). Use the horizontal axis for the customer age to graph. Find the linear regression line that models the data by each type of customer. Round the rate of changes (slopes) to two decimal places and interpret them in terms of the relation between the change in age and the change in net sales. What can you conclude? Hint: Rate of Change = Vertical Change / Horizontal Change = Change in y / Change in xarrow_forwardIn multiple regression, you can have nominal and continuous predictors true or falsearrow_forwardDescribe how correlation and regression are linked yet distinct.arrow_forward
- Suppose you wanted to test whether or not the payoff to an additional year of education was the same for men and women in the STEM majors. How would you set up your regression analysis in this casearrow_forwardExplain how to find searrow_forwardWhat's a good topic for a regression topic? Make sure you have two quantitative variables (for example # of siblings and heart rate). Ask for another variable like academic year, major, hobbies, favorite genre of movie. - State the independent and dependent variables and what is the population.arrow_forward
- please answer the third and fourth partarrow_forwardAn economist at Nedbank ran a study of the relationship between FTSE/JSE All Shares index return (JALSH) and consumer price index (CPI) from 2006 to 2017, the data collected is shown in the Table 1 below. FTSE/JSE All Shares index return (JALSH) and consumer price index (CPI) from 2006 to 2017. Year JALSH (Y) CPI (X) 2006 0.41 4.7 2007 0.19 7.1 2008 -0.23 11.5 2009 0.32 7.1 2010 0.19 4.3 2011 0.03 5.0 2012 0.27 5.6 2013 0.21 5.7 2014 0.11 6.1 2015 0.05 4.6 2016 0.00 6.4 2017 0.21 5.3 The estimated regression…arrow_forward
arrow_back_ios
arrow_forward_ios
Recommended textbooks for you
- MATLAB: An Introduction with ApplicationsStatisticsISBN:9781119256830Author:Amos GilatPublisher:John Wiley & Sons Inc
 Probability and Statistics for Engineering and th...StatisticsISBN:9781305251809Author:Jay L. DevorePublisher:Cengage Learning
 Statistics for The Behavioral Sciences (MindTap C...StatisticsISBN:9781305504912Author:Frederick J Gravetter, Larry B. WallnauPublisher:Cengage Learning
  Elementary Statistics: Picturing the World (7th E...StatisticsISBN:9780134683416Author:Ron Larson, Betsy FarberPublisher:PEARSON
 The Basic Practice of StatisticsStatisticsISBN:9781319042578Author:David S. Moore, William I. Notz, Michael A. FlignerPublisher:W. H. Freeman
 Introduction to the Practice of StatisticsStatisticsISBN:9781319013387Author:David S. Moore, George P. McCabe, Bruce A. CraigPublisher:W. H. Freeman
MATLAB: An Introduction with Applications
Statistics
ISBN:9781119256830
Author:Amos Gilat
Publisher:John Wiley & Sons Inc
Probability and Statistics for Engineering and th...
Statistics
ISBN:9781305251809
Author:Jay L. Devore
Publisher:Cengage Learning
Statistics for The Behavioral Sciences (MindTap C...
Statistics
ISBN:9781305504912
Author:Frederick J Gravetter, Larry B. Wallnau
Publisher:Cengage Learning
Elementary Statistics: Picturing the World (7th E...
Statistics
ISBN:9780134683416
Author:Ron Larson, Betsy Farber
Publisher:PEARSON
The Basic Practice of Statistics
Statistics
ISBN:9781319042578
Author:David S. Moore, William I. Notz, Michael A. Fligner
Publisher:W. H. Freeman
Introduction to the Practice of Statistics
Statistics
ISBN:9781319013387
Author:David S. Moore, George P. McCabe, Bruce A. Craig
Publisher:W. H. Freeman