ENGR.ECONOMIC ANALYSIS
14th Edition
ISBN: 9780190931919
Author: NEWNAN
Publisher: Oxford University Press
expand_more
expand_more
format_list_bulleted
Question
QUESTION 37
-
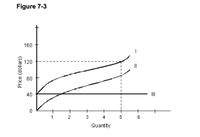
In Figure 7-3, curve II is the
a. total-fixed-cost curve.
b. average-variable-cost curve.
c. total-cost curve.
d. total-variable-cost curve.
e. average-total-cost curve.

Transcribed Image Text:Figure 7-3
160
120
||
80
40
II
1
2
3
4
5
6
Quantity
Price (dollars)
Expert Solution
This question has been solved!
Explore an expertly crafted, step-by-step solution for a thorough understanding of key concepts.
This is a popular solution
Trending nowThis is a popular solution!
Step by stepSolved in 2 steps

Knowledge Booster
Learn more about
Need a deep-dive on the concept behind this application? Look no further. Learn more about this topic, economics and related others by exploring similar questions and additional content below.Similar questions
- Nonearrow_forward10.Which of the following is an example of a fixed cost? A. cost of employees who work overtime B. cost of machinery C. cost of flour at a bakery D. cost of employees who work standard hoursarrow_forward30.Refer to Figure 1. Curve 1 is Outdoor Equipment's Select one: a. Marginal cost curve. b. Average total cost curve. c. Average fixed cost curve. d. Average variable cost curve.arrow_forward
- Learning by doing is represented by A. no change in the average total cost curve. B. an increase in the average total cost curve. C. a decrease in the average total cost curve. D. an increase in the average total cost curve and a decrease in the marginal cost curvearrow_forward. With the aid of a clearly labelled diagram illustrate;i.The least cost criterion for cost minimization ii.At what point does the least cost combination of inputs occur? iii.What are the optimal solutions to cost minimization?arrow_forward5. True, false, or uncertain? Explain briefly but specifically. a. A cost function exhibits diseconomies of scale if the marginal cost rises as output decreases. b. Short run average cost is always at least as much as long run average cost.arrow_forward
- 4.The Marginal Cost Curve is shaped like a Nike swoosh. graph. 5.The Marginal Cost Curve crosses the Average Total Cost curve and Average Variable Cost curves at the lowest point. graph.arrow_forwardQUESTION 2 Figure and Table: Variable, Fixed, and Total Costs Total cost $2,500 2,000 1,500 1,000 500 Points on Graph A B C E 0 G H I A B₁ Reference: Ref 6-11 с 20 1 1 1 40 60 80 100 Quantity of wheat (bushels) DEFGH Total cost, TC Quantity of Labor (workers), L 0 1 2 3 4 6 8 Quantity of Wheat (bushels), Q 0 PORTARI 19 36 51 64 75 84 91 96 Variable Cost, VC $ 0 200 400 600 800 1,000 1,200 1,400 1,600 Fixed Cost, FC $400 400 400 400 400 400 400 400 400 Total Cost, TC $ FC + VC 400 600 800 1,000 1,200 1,400 1,600 1,800 2,000 (Figure and Table: Variable, Fixed, and Total Costs) The marginal cost of increasing production from 0 to 19 bushels of wheat is: OA. $22.22. B. $11.76. OC. $10.53 D. $11.11. OE. $23.53.arrow_forwardquestion # 2arrow_forward
- Use the graph from class to find 1. Marginal Cost at 100; 2. Total Cost at 100; 3. Variable Cost at 100; 4. Fixed Cost at 100. Construct your own graphs similar to the ones from class. Use your diagram to show . 5. Whether or not reducing the quantity produced will always reduce the total cost. 6. Whether or not reducing the quantity produced will always reduce the average total cost. 7. Whether or not reducing the quantity produced will always reduce the marginal cost. 59 30 10- 5 MC ATC AVC 100 0arrow_forward1. When Fixed Cost change, which of the following other costs will change? Explain why you selected the costs you did. Variable Cost Total Cost Average Total Cost Average Variable Cost Average Fixed Cost Marginal Cost 2. When Variable Cost change, which of the following other costs will change? Explain why you selected the costs you did. Fixed Cost Total Cost Average Total Cost Average Variable Cost Average Fixed Cost Marginal Cost 3. What assumption is made concerning short-run production that causes the short-run cost curves to have their typical shapes?arrow_forward2. You are thinking about setting up a lemonade stand. The stand itself costs $200. The ingredients for each cup of lemonade cost $0.50. a. How much is your fixed cost of doing business? How much is your variable cost per cup? b. Construct a table showing your total cost, average total cost, and marginal cost for output levels varying from 0 to 10 gallons. (Hint: There are 16 cups in a gallon)arrow_forward
arrow_back_ios
arrow_forward_ios
Recommended textbooks for you

 Principles of Economics (12th Edition)EconomicsISBN:9780134078779Author:Karl E. Case, Ray C. Fair, Sharon E. OsterPublisher:PEARSON
 Engineering Economy (17th Edition)EconomicsISBN:9780134870069Author:William G. Sullivan, Elin M. Wicks, C. Patrick KoellingPublisher:PEARSON
 Principles of Economics (MindTap Course List)EconomicsISBN:9781305585126Author:N. Gregory MankiwPublisher:Cengage Learning
 Managerial Economics: A Problem Solving ApproachEconomicsISBN:9781337106665Author:Luke M. Froeb, Brian T. McCann, Michael R. Ward, Mike ShorPublisher:Cengage Learning
 Managerial Economics & Business Strategy (Mcgraw-...EconomicsISBN:9781259290619Author:Michael Baye, Jeff PrincePublisher:McGraw-Hill Education


Principles of Economics (12th Edition)
Economics
ISBN:9780134078779
Author:Karl E. Case, Ray C. Fair, Sharon E. Oster
Publisher:PEARSON

Engineering Economy (17th Edition)
Economics
ISBN:9780134870069
Author:William G. Sullivan, Elin M. Wicks, C. Patrick Koelling
Publisher:PEARSON

Principles of Economics (MindTap Course List)
Economics
ISBN:9781305585126
Author:N. Gregory Mankiw
Publisher:Cengage Learning

Managerial Economics: A Problem Solving Approach
Economics
ISBN:9781337106665
Author:Luke M. Froeb, Brian T. McCann, Michael R. Ward, Mike Shor
Publisher:Cengage Learning

Managerial Economics & Business Strategy (Mcgraw-...
Economics
ISBN:9781259290619
Author:Michael Baye, Jeff Prince
Publisher:McGraw-Hill Education