
MATLAB: An Introduction with Applications
6th Edition
ISBN: 9781119256830
Author: Amos Gilat
Publisher: John Wiley & Sons Inc
expand_more
expand_more
format_list_bulleted
Related questions
Question
Provide Calculation and Please Give Correct and incorrect opiton explanation

Transcribed Image Text:B
56°F
Sunny
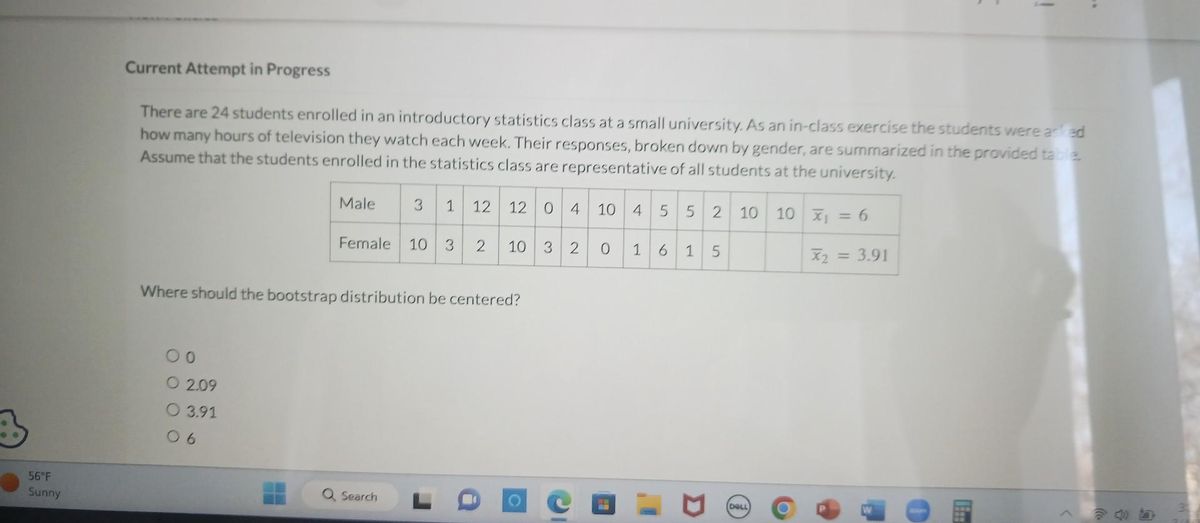
Current Attempt in Progress
There are 24 students enrolled in an introductory statistics class at a small university. As an in-class exercise the students were asked
how many hours of television they watch each week. Their responses, broken down by gender, are summarized in the provided table
Assume that the students enrolled in the statistics class are representative of all students at the university.
Male
3 1 12 12
0
4
10 4 5 52 10
10 x₁ = 6
Female
10 3
2
10 3 2 0
1
6
1 5
X2
= 3.91
Where should the bootstrap distribution be centered?
00
O 2.09
O 3.91
06
Q Search
DOLL
0
^
33
Expert Solution
This question has been solved!
Explore an expertly crafted, step-by-step solution for a thorough understanding of key concepts.

Step by stepSolved in 3 steps

Knowledge Booster

Similar questions
- 1. CIRCLE DIAMETER= CENTER = (-/2, %3Darrow_forwardFind the z value that corresponds to the given area in the figure below. Use a graphing calculator and round the answer to four decimal places. 0.9805 0. Continue Submit A ©2021 McGraw-Hill Education. All Rights Reserved. Terms of Use | Privacyarrow_forwardUse a z-table such as https://www.math.arizona.edu/~rsims/ma464/standardnormaltable.pdf or an online calculator such as http://onlinestatbook.com/2/calculators/normal_dist.html to answer the following question: This question again refers to the study on blood pressure. What proportion of the population has a blood pressure that is below the value 101.3 mmHg for a normally-distributed set of blood pressures with a mean of 120.1 mmHg and a standard deviation of 15.1 mmHg? Express your answer as a percentage rounded off to 1 decimal place. For the value from the previous question you just answered, what percentage of the population would have a blood pressure higher than this value? Express your answer as a percentage rounded to 1 decimal place and show your calculations below.arrow_forward
arrow_back_ios
arrow_forward_ios
Recommended textbooks for you
- MATLAB: An Introduction with ApplicationsStatisticsISBN:9781119256830Author:Amos GilatPublisher:John Wiley & Sons Inc
 Probability and Statistics for Engineering and th...StatisticsISBN:9781305251809Author:Jay L. DevorePublisher:Cengage Learning
 Statistics for The Behavioral Sciences (MindTap C...StatisticsISBN:9781305504912Author:Frederick J Gravetter, Larry B. WallnauPublisher:Cengage Learning
  Elementary Statistics: Picturing the World (7th E...StatisticsISBN:9780134683416Author:Ron Larson, Betsy FarberPublisher:PEARSON
 The Basic Practice of StatisticsStatisticsISBN:9781319042578Author:David S. Moore, William I. Notz, Michael A. FlignerPublisher:W. H. Freeman
 Introduction to the Practice of StatisticsStatisticsISBN:9781319013387Author:David S. Moore, George P. McCabe, Bruce A. CraigPublisher:W. H. Freeman
MATLAB: An Introduction with Applications
Statistics
ISBN:9781119256830
Author:Amos Gilat
Publisher:John Wiley & Sons Inc
Probability and Statistics for Engineering and th...
Statistics
ISBN:9781305251809
Author:Jay L. Devore
Publisher:Cengage Learning
Statistics for The Behavioral Sciences (MindTap C...
Statistics
ISBN:9781305504912
Author:Frederick J Gravetter, Larry B. Wallnau
Publisher:Cengage Learning
Elementary Statistics: Picturing the World (7th E...
Statistics
ISBN:9780134683416
Author:Ron Larson, Betsy Farber
Publisher:PEARSON
The Basic Practice of Statistics
Statistics
ISBN:9781319042578
Author:David S. Moore, William I. Notz, Michael A. Fligner
Publisher:W. H. Freeman
Introduction to the Practice of Statistics
Statistics
ISBN:9781319013387
Author:David S. Moore, George P. McCabe, Bruce A. Craig
Publisher:W. H. Freeman