
FINANCIAL ACCOUNTING
10th Edition
ISBN: 9781259964947
Author: Libby
Publisher: MCG
expand_more
expand_more
format_list_bulleted
Related questions
Question
Shown below are Apple Inc’s Consolidated Statements of Operations for years ended September 24, 2022; September 25, 2021 and September 26, 2020; and Consolidated Balance Sheets at September 24, 2022 and September 25, 2021. Determine the following for apple
a) return on equity for the year ended September 24,2022
b) Acid-test ratio at September 24,2022
c) Number of days sales in accounts receivable at September 24, 2022
d) Inventory turnover for the year ended September 24,2022,
e. With a common stock market price of $150.43 at September 24,2022, the Price Earnings ratio for the year ended September 24, 2022
f. Do you consider the PE ratio in part e to be below average, average or above average? Why?
g. The debt to equity ratio at September 24, 2022
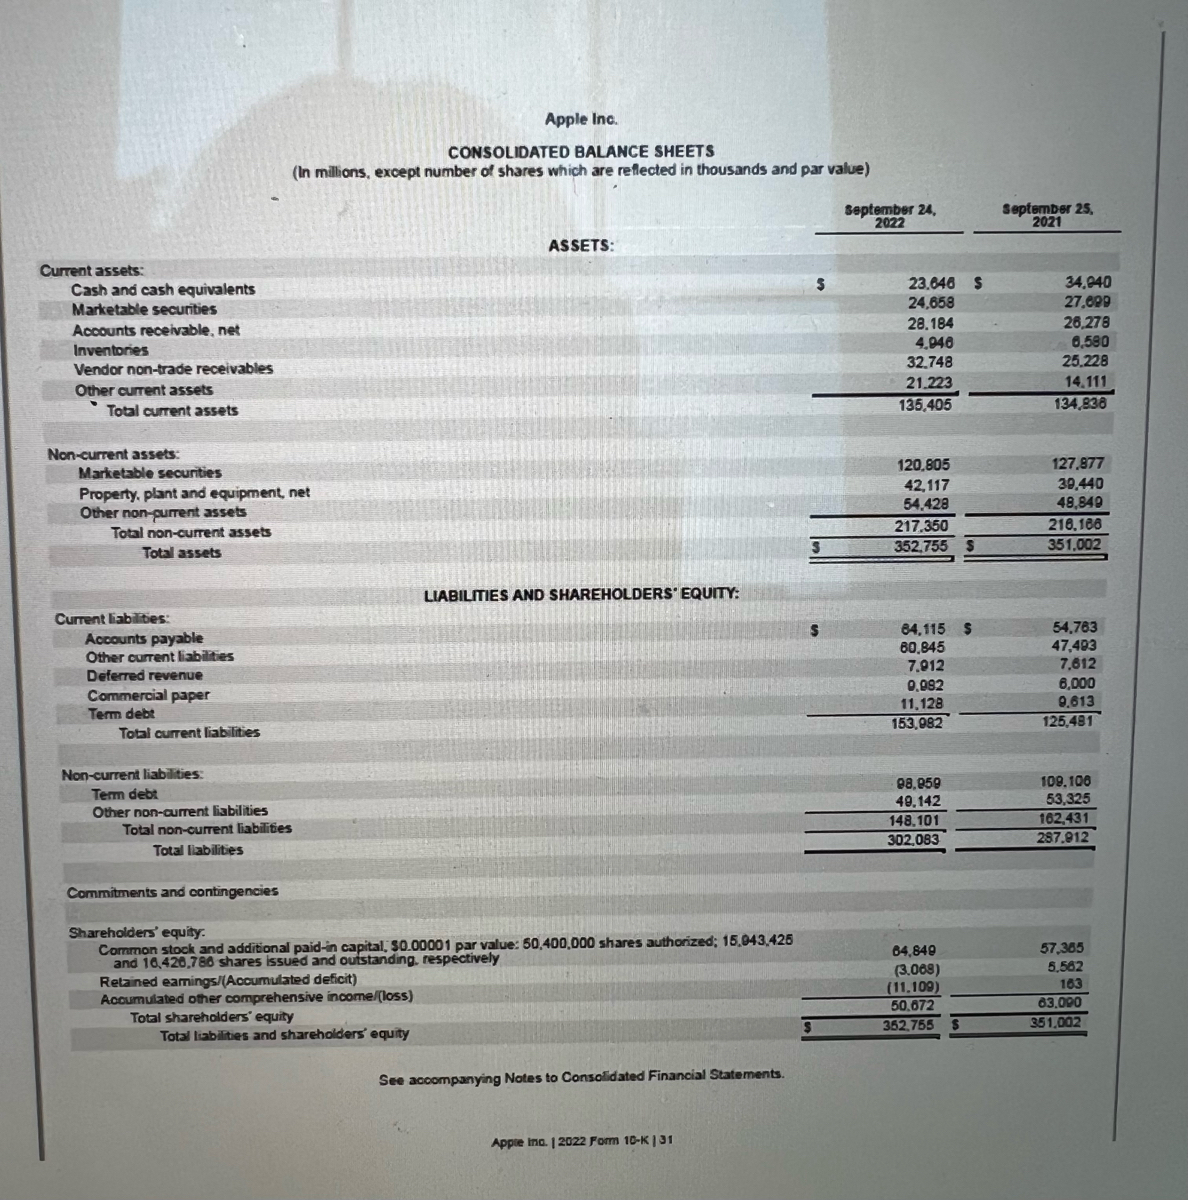

Transcribed Image Text:## Apple Inc.
### CONSOLIDATED BALANCE SHEETS
*(In millions, except number of shares which are reflected in thousands and par value)*
#### ASSETS:
**September 24, 2022** | **September 25, 2021**
- **Current assets:**
- Cash and cash equivalents: $23,646 | $34,940
- Marketable securities: $24,658 | $27,699
- Accounts receivable, net: $28,184 | $26,278
- Inventories: $4,040 | $6,580
- Vendor non-trade receivables: $32,748 | $26,228
- Other current assets: $21,723 | $14,111
- **Total current assets:** $135,405 | $134,836
- **Non-current assets:**
- Marketable securities: $120,805 | $127,877
- Property, plant and equipment, net: $42,117 | $39,440
- Other non-current assets: $54,428 | $48,849
- **Total non-current assets:** $217,350 | $216,166
- **Total assets:** $352,755 | $351,002
#### LIABILITIES AND SHAREHOLDERS' EQUITY:
- **Current liabilities:**
- Accounts payable: $64,115 | $54,763
- Other current liabilities: $80,845 | $47,493
- Deferred revenue: $7,912 | $7,812
- Commercial paper: $9,622 | $6,009
- Term debt: $11,488 | $9,403
- **Total current liabilities:** $153,982 | $125,480
- **Non-current liabilities:**
- Term debt: $98,959 | $109,106
- Other non-current liabilities: $49,142 | $53,325
- **Total non-current liabilities:** $148,101 | $162,431
- **Total liabilities:** $302,083 | $287,912
- **Shareholders' equity:**
- Common stock and additional paid-in capital (par value: $0.00001 per value; 50,400,000 shares authorized; 16,

Transcribed Image Text:**Important Financial Metrics Calculation Using Apple Inc.'s Consolidated Financial Statements**
The text below illustrates critical financial metrics for Apple Inc. using its Consolidated Statements of Operations and the Consolidated Balance Sheets for the years ending September 24, 2022, September 25, 2021, and September 26, 2020. Below are the analysis and calculations for the given date.
1. **Return on Equity (ROE) for the year ended September 24, 2022:**
- ROE = Net Income / Shareholder's Equity.
- Shareholder’s equity details need to be extracted from the balance sheet data which isn't provided in the image. However, the formula entails dividing the net income by the shareholders' equity for the given period.
2. **Acid-Test Ratio at September 24, 2022:**
- Acid-Test Ratio = (Current Assets - Inventories) / Current Liabilities.
- Specific values for current assets, inventories, and current liabilities are not detailed in the provided segment; refer to the balance sheet for these figures to compute the ratio.
3. **Number of Days Sales in Accounts Receivable at September 24, 2022:**
- Days Sales Outstanding = (Accounts Receivable / Total Sales) * Number of Days.
- Precise accounts receivable numbers are necessary from the balance sheet along with total sales indicated in the income statement.
4. **Inventory Turnover for the year ended September 24, 2022:**
- Inventory Turnover = Cost of Goods Sold (COGS) / Average Inventory.
- The COGS can be found in the income statement, while average inventory values are needed from the balance sheets of the beginning and end of the period.
5. **Price Earnings (PE) Ratio at September 24, 2022:**
- PE Ratio = Market Value per Share / Earnings Per Share (EPS).
- Given: Market price per share = $150.43.
- EPS for 2022 (Basic) = $6.15 (from the income statement).
- PE Ratio = $150.43 / $6.15 = 24.46.
6. **Evaluation of the PE Ratio:**
- To determine if the PE ratio is below average, average, or above average, one needs to compare it with industry averages or historical company data. Generally, a PE ratio of 24.
Expert Solution
This question has been solved!
Explore an expertly crafted, step-by-step solution for a thorough understanding of key concepts.

This is a popular solution

Trending nowThis is a popular solution!

Step by stepSolved in 5 steps

Knowledge Booster


Learn more about
Need a deep-dive on the concept behind this application? Look no further. Learn more about this topic, accounting and related others by exploring similar questions and additional content below.Similar questions
- Use the following tables to answer the question: LOGIC COMPANY Income Statement For years ended December 31, 2016 and 2017 (values in $) 2016 2017 Gross sales 19,800 15,600 Sales returns and allowances 900 100 Net sales 18,900 15,500 COGS 11,800 8,800 Gross profit 7,100 6,700 Depreciation 780 640 Selling and administrative expenses 2,800 2,400 Research 630 540 Miscellaneous 440 340 Total operating expenses 4,650 3,920 Income before interest and taxes 2,450 2,780 Interest expense 640 540 Income before taxes 1,810 2,240 Provision for taxes 724 896 LOGIC COMPANY Balance Sheet For years ended December 31, 2016 and 2017 (values in $) 2016 2017 Current assets 12,300 9,400 Accounts receivable 16,900 12,900 Merchandise inventory 8,900 14,400 Prepaid expenses 24,400 10,400 Total current assets 62,500 47,100 Building (net) 14,900 11,400 Land 13,900 9,400 Total plant and equipment 28,800 20,800 Total assets 91,300 67,900 Accounts payable 13,400 7,400 Salaries payable 7,500 5,400 Total current…arrow_forwardWhat is the year-over-year revenue change percent? Use the attached financial data to calculate the ratios for 2022. Round to the nearest decimal. Abercrombie & Fitch Co (ANF) Financial Data Revenues Cost of Sales Total Operating Expenses Interest Expense Income Tax Expense Diluted Weighted Shares Outstanding Cash + Equivalents Accounts Receivable Inventories Total Current Assets Total Assets Accounts Payable Total Current Liabilities Total Stockholders' Equity ANF Stock Price = $10.30 Select one O A. 5.3% B. 14.4% C. -1.4% O D. -3.5% 2022 $3,659.3 $1,545.9 $2,026.9 $28.5 $37.8 52.8 $257.3 $108.5 $742.0 $1,220.4 $2,694.0 $322.1 $935.5 $656.1 2021 $3,712.8 $1,400.8 $1,968.9 $34.1 $38.9 62.6 $823.1 $69.1 $525.9 $1,507.8 $2,939.5 $374.8 $1,015.2 $826.1arrow_forwardCAN SOMEONE HELP ME WITH THE RATIOS? The comparative statements of Wahlberg Company are presented here. Wahlberg CompanyIncome StatementFor the Years Ended December 31 2020 2019 Net sales $1,813,600 $1,750,700 Cost of goods sold 1,007,100 978,000 Gross profit 806,500 772,700 Selling and administrative expenses 519,800 472,000 Income from operations 286,700 300,700 Other expenses and losses Interest expense 17,100 14,200 Income before income taxes 269,600 286,500 Income tax expense 80,015 77,500 Net income $ 189,585 $ 209,000 Wahlberg CompanyBalance SheetsDecember 31 Assets 2020 2019 Current assets Cash $60,600 $64,600 Debt investments (short-term) 69,100 50,300 Accounts receivable 117,500 102,800 Inventory 123,600 115,600 Total…arrow_forward
- Shown below are Apple Inc's Consolidated Statements of Operations for years ended September 24, 2022, September 25, 2021, and September 26, 2020; and Consolidated Balance Sheets at September 24, 2022, and September 25, 2021. Determine the following (show your work) for Apple Inc: a. Return on Equity for the year ended September 24, 2022. b. Acid-test ratio at September 24, 2022 Number of days sales in accounts receivable at September 24, 2022 Inventory turnover for the year ended September 24, 2022 With a common stock market price of $150.43 at September 24, 2022, the Price Earnings Ratio for the year ended september 24, 2022. C. d. e. f. 8. Do you conider the PE ratio in part e to be below average, average or above average? Why? The debt to equity ratio at September 24, 2022 Net sales: Products Services Total net sales Cost of sales: Products Services Total cost of sales Gross margin Operating expenses: Research and development Selling, general and administrative Total operating…arrow_forwardForecasting with the Parsimonious Method and Estimating Share Value Using the DCF Model Following are income statements and balance sheets for Cisco Systems. Note: Complete the entire question in Excel and format each answer to two decimal places. Then enter the answers into the provided spaces below with two decimal places. Cisco Systems Consolidated Statements of Income Years Ended December ($ millions) July 27, 2019 July 28, 2018 Revenue Product $33,544 $31,570 Service 11,093 10,854 Total revenue 44,637 42,424 Cost of sales Product 12,782 12,407 Service 3,763 3,695 Total cost of sales 16,545 16,102 Gross margin 28,092 26,322 Operating expenses Research and development 5,656 5,446 Sales and marketing 8,231 7,948 General and administrative 1,571 1,844 Amortization of purchased intangible assets 129 190 Restructuring and other charges 277 308 Total operating expenses 15,864 15,736 Operating income 12,228 10,586 Interest income 1,125 1,297 Interest expense (739) (811) Other…arrow_forwardThe following ratios have been computed for Pina Colada Company for 2022. Profit margin ratio 20 % Current ratio 2.5 :1 Times interest earned 12 times Debt to assets ratio 24 % Accounts receivable turnover 5 times Use the above ratios and information from the Pina Colada Company financial statements to fill in the missing information on the financial statements.The 2022 financial statements for Pina Colada Company with missing information follows: (Include calculations) PINA COLADA COMPANYComparative Balance SheetDecember 31, 2022 2021 Assets Cash $ 26,500 $ 37,100 Debt Investments 15,900 15,900 Accounts receivable (net) 53,000 Inventory 53,000 Property, plant, and equipment (net) 212,000 169,600 Total assets Liabilities and stockholders' equity Accounts payable $ 15,900 $ 26,500 Short-term notes payable 37,100 31,800 Bonds payable Enter…arrow_forward
- Use the Ulta annual report to calculate profit margin, total debt ratio, and cash ratio for the year ending in 2021.arrow_forwardSuppose selected comparative statement data for the giant bookseller Barnes & Noble are as follows. All balance sheet data are as of the end of the fiscal year (in millions). Net sales Cost of goods sold Net income Accounts receivable Inventory Total assets Total common stockholders' equity 2022 $4,750.0 3.300.3 85.3 75.1 1,150.0 2,850.0 900.2 2021 $5,500.6 3,700.6 110.1 102.2 1.250.0 3,250.1 1.120.7arrow_forwardSummary financial information for Gandaulf Company is as follows. Compute the amount and percentage changes in 2022 using horizontal analysis, assuming 2024 is the base year. (Enter negative amounts and percentages using either a negative sign preceding the number e.g. -45,-45% or parentheses e.g. (45), (45%). Round percentages to 2 decimal places, e.g. 1.25%.) Current Assets Dec. 31, 2022 Dec. 31, 2024 $191,100 $210,000 $ Plant Assets 1,058,600 790,000 Total assets $1,249,700 $1,000,000 $ Increase (Decrease) in 2022 Amount Percent % % %arrow_forward
- Current Attempt in Progress Operating data for Grouper Corp. are presented as follows. Net sales Cost of goods sold Selling expenses Administrative expenses Income tax expense Net income 2022 $840,000 540,120 133,560 57,120 31,920 77,280 2021 $610,000 405,650 80,520 46,970 26,840 50,020 Prepare a schedule showing a vertical analysis for 2022 and 2021. (Round percentages to 1 decimal place, e.g. 12.1%.)arrow_forwardUsing these data from the comparative balance sheets of Bonita Company, perform a vertical analysis. Accounts receivable (net) Inventory Total assets (Round percentages to 1 decimal place, e.g. 12.1%.) Accounts receivable (net) Inventory Total assets Amount $435.960 December 31, 2022 December 31, 2021 $422,800 720.720 2.520,000 $435.960 December 31, 2022 720.720 2,520.000 Percentage 624,400 2,800,000 Amount $422,800 624,400 2.800,000 December 31, 2021 Percentage % 8arrow_forwardSelected hypothetical comparative statement data for the giant bookseller Barnes & Noble are presented here. All balance sheet data are as of the end of the fiscal year (in millions). Net sales Cost of goods sold Net income Accounts receivable (net) Inventory Total assets Total common stockholders' equity a. b. C. d. e. Profit margin Asset turnover Return on assets 2025 $5,050.3 Gross profit rate 3,700.7 65.1 65.0 1.250.1 Compute the following ratios for 2025. (Round asset turnover to 2 decimal places, e.g 1.83 and all other answers to 1 decimal place, e.g. 1.8 or 2.5%) 2,950.1 940.6 Return on common stockholders' equity 2024 $5,800.9 3,200.1 190.9 106.6 1,350.1 3,250.1 1,100.5 % times % % %arrow_forward
arrow_back_ios
SEE MORE QUESTIONS
arrow_forward_ios
Recommended textbooks for you
 AccountingAccountingISBN:9781337272094Author:WARREN, Carl S., Reeve, James M., Duchac, Jonathan E.Publisher:Cengage Learning,
 Accounting Information SystemsAccountingISBN:9781337619202Author:Hall, James A.Publisher:Cengage Learning,
 Horngren's Cost Accounting: A Managerial Emphasis...AccountingISBN:9780134475585Author:Srikant M. Datar, Madhav V. RajanPublisher:PEARSON
 Intermediate AccountingAccountingISBN:9781259722660Author:J. David Spiceland, Mark W. Nelson, Wayne M ThomasPublisher:McGraw-Hill Education
 Financial and Managerial AccountingAccountingISBN:9781259726705Author:John J Wild, Ken W. Shaw, Barbara Chiappetta Fundamental Accounting PrinciplesPublisher:McGraw-Hill Education
Accounting
Accounting
ISBN:9781337272094
Author:WARREN, Carl S., Reeve, James M., Duchac, Jonathan E.
Publisher:Cengage Learning,
Accounting Information Systems
Accounting
ISBN:9781337619202
Author:Hall, James A.
Publisher:Cengage Learning,
Horngren's Cost Accounting: A Managerial Emphasis...
Accounting
ISBN:9780134475585
Author:Srikant M. Datar, Madhav V. Rajan
Publisher:PEARSON
Intermediate Accounting
Accounting
ISBN:9781259722660
Author:J. David Spiceland, Mark W. Nelson, Wayne M Thomas
Publisher:McGraw-Hill Education
Financial and Managerial Accounting
Accounting
ISBN:9781259726705
Author:John J Wild, Ken W. Shaw, Barbara Chiappetta Fundamental Accounting Principles
Publisher:McGraw-Hill Education