
Essentials Of Investments
11th Edition
ISBN: 9781260013924
Author: Bodie, Zvi, Kane, Alex, MARCUS, Alan J.
Publisher: Mcgraw-hill Education,
expand_more
expand_more
format_list_bulleted
Related questions
Concept explainers
Topic Video
Question
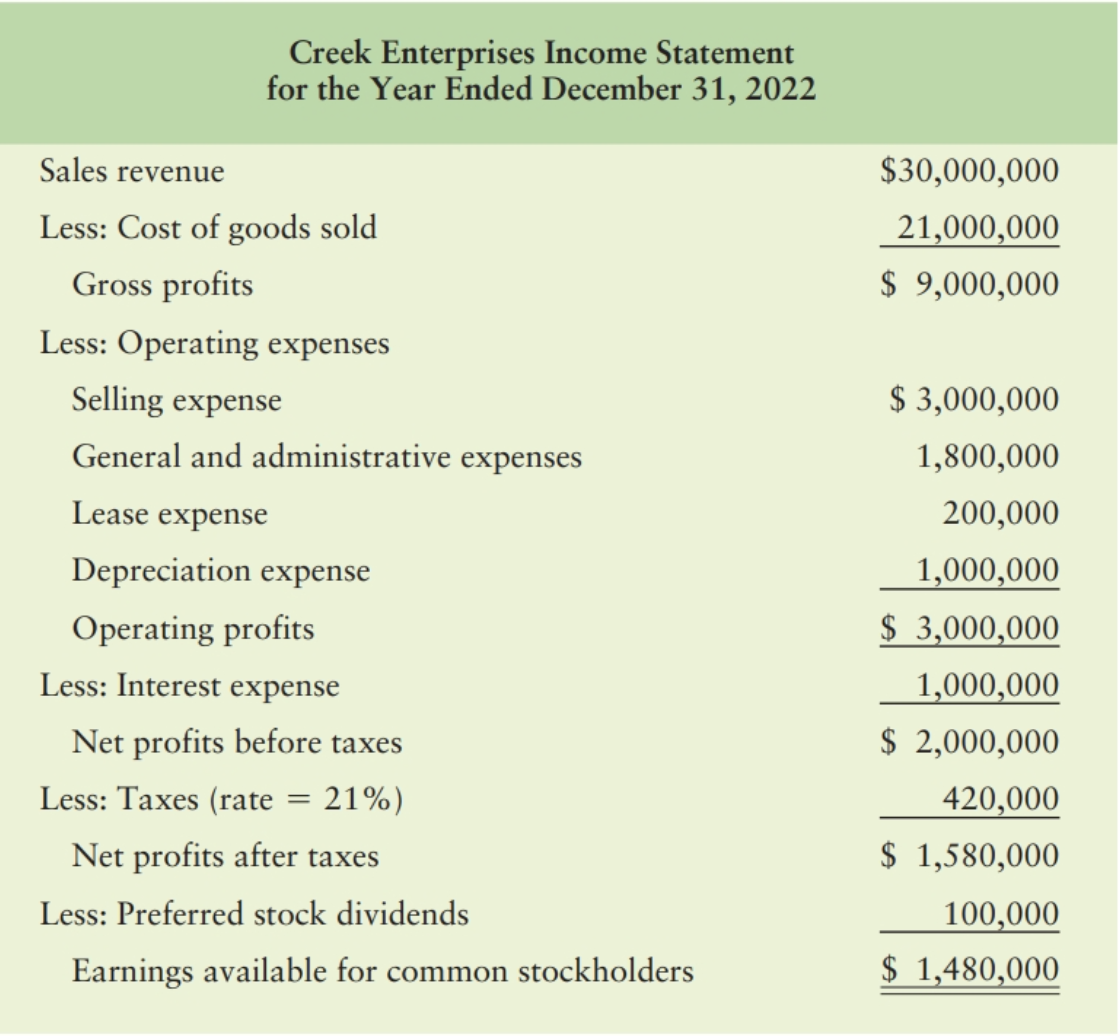
Common-size statement analysis A common-size income statement for Creek Enterprises’ 2021 operations follows. Using the firm’s 2022 income statement, develop the 2022 common-size income statement and compare it with the 2021 common-size statement. Which areas require further analysis and investigation?

Transcribed Image Text:### Creek Enterprises Income Statement
### For the Year Ended December 31, 2022
#### Revenue and Expenses Breakdown:
- **Sales revenue**: $30,000,000
- **Less: Cost of goods sold**: $21,000,000
- **Gross profits**: $9,000,000
#### Operating Expenses:
- **Selling expense**: $3,000,000
- **General and administrative expenses**: $1,800,000
- **Lease expense**: $200,000
- **Depreciation expense**: $1,000,000
- **Total Operating expenses**: $6,000,000
- **Operating profits**: $3,000,000
#### Interest and Taxes:
- **Less: Interest expense**: $1,000,000
- **Net profits before taxes**: $2,000,000
- **Less: Taxes (rate = 21%)**: $420,000
- **Net profits after taxes**: $1,580,000
#### Dividends:
- **Less: Preferred stock dividends**: $100,000
- **Earnings available for common stockholders**: $1,480,000
---
### Explanation of Components:
- **Sales revenue** represents the total income from sales before any expenses are deducted.
- **Cost of goods sold (COGS)** is the direct costs attributable to the production of the goods sold.
- **Gross profits** is calculated as sales revenue minus cost of goods sold.
- **Operating expenses** include all the costs associated with running the business aside from the cost of goods sold, including Selling expense, General and administrative expenses, Lease expense, and Depreciation expense.
- **Operating profits** is the profit earned from a firm's normal core business operations.
- **Interest expense** is the cost incurred by an entity for borrowed funds.
- **Net profits before taxes** is the amount of profit before any tax has been deducted.
- **Taxes** are calculated at a rate of 21%.
- **Net profits after taxes** is the profit remaining after all operating expenses, interest, and taxes have been deducted.
- **Preferred stock dividends** are the dividends that are paid out to preferred stockholders.
- **Earnings available for common stockholders** is the profit left after all expenses, taxes, and preferred dividends have been paid

Transcribed Image Text:### Creek Enterprises Common-Size Income Statement for the Year Ended December 31, 2021
#### Income Statement Breakdown
**Sales Revenue ($35,000,000):** 100.0%
**Less: Cost of Goods Sold (COGS):** 65.9%
- This represents the direct costs attributable to the production of the goods sold by Creek Enterprises.
**Gross Profits:** 34.1%
- Gross profit is calculated by subtracting the cost of goods sold from the sales revenue.
**Less: Operating Expenses:**
- **Selling Expense:** 12.7%
- Costs associated with the sales process, such as advertising and sales commissions.
- **General and Administrative Expenses:** 6.3%
- Overhead costs not tied to production, including salaries for administrative staff, utilities, and office supplies.
- **Lease Expense:** 0.6%
- Costs for leasing property or equipment.
- **Depreciation Expense:** 3.6%
- Allocated cost of tangible fixed assets over their useful lives.
**Total Operating Expense:** 23.2%
- Sum of all operating expenses.
**Operating Profits:** 10.9%
- Calculated by subtracting total operating expenses from gross profits. Also known as operating income or EBIT (Earnings Before Interest and Taxes).
**Less: Interest Expense:** 1.5%
- Cost incurred by the entity for borrowed funds.
**Net Profits Before Taxes:** 9.4%
- Profits remaining after deducting interest expense from operating profits.
**Less: Taxes (rate = 21%):** 2.0%
- Tax expense calculated at a rate of 21% on net profits before taxes.
**Net Profits After Taxes:** 7.4%
- Profits remaining after deducting the tax expense.
**Less: Preferred Stock Dividends:** 0.1%
- Dividends that must be paid to preferred shareholders before any earnings are available for common stockholders.
**Earnings Available for Common Stockholders:** 7.3%
- Net profits after taxes minus preferred stock dividends, representing the earnings available to common shareholders.
#### Detailed Analysis
The provided common-size income statement allows for easy comparison across periods and with other companies by expressing each line item as a percentage of total sales revenue. This format facilitates trend analysis and operational efficiency assessment.
Understanding these components is crucial for stakeholders, including students of finance and business,
Expert Solution
This question has been solved!
Explore an expertly crafted, step-by-step solution for a thorough understanding of key concepts.

This is a popular solution

Trending nowThis is a popular solution!

Step by stepSolved in 4 steps

Knowledge Booster


Learn more about
Need a deep-dive on the concept behind this application? Look no further. Learn more about this topic, finance and related others by exploring similar questions and additional content below.Similar questions
- The comparative statement of financial position of Marigold Inc. as at June 30.2023, and a statement of comprehensive income for the 2023 fiscal year follow MARIGOLD INC. Statement of Financial Position June 30.2023 Assets Cash Accounts receivable Inventory Prepaid expenses FV-OCI investments Equipment Accumulated depreciation-equipment Total Liabilities and Shareholders' Equity Accounts payable Income tax payable Dividends payable Long-term notes payable Common shares Retained earnings Accumulated other comprehensive income Total June 30 2023 2022 $ 20.000 $ 44,000 86.200 72.400 104,000 101,400 2,800 5,600 48,000 44,900 171.000 158,500 (34,400) (25.000) $ 397.600 $ 401.800 $ 114,000 $ 102,000 1,700 3,500 4,800 80,700 122,000 30,100 24.200 155,000 141,900 11,300 8.200 $ 397,600 $ 401.800 MARIGOLD INC. Statement of Comprehensive Income For the Year Ended June 30, 2023 Net sales $340,000 Cost of goods sold 175,000 Grass profe 165,000 Operating expenses 123,500 Income from operations…arrow_forwardIncome statement and balance sheet data for The Athletic Attic are provided below.Required: 1. Calculate the following risk ratios for 2021 and 2022: a. Receivables turnover ratio. c. Current ratio. b. Inventory turnover ratio. d. Debt to equity ratio. 2. Calculate the following profitability ratios for 2021 and 2022: a. Gross profit ratio. c. Profit margin. b. Return on assets. d. Asset turnover. 3. Based on the ratios calculated, determine whether overall risk and profitability improved from 2021 to 2022.arrow_forwardShow how the ROCE ratio for ABC Ltd. the company that we have been discussing this week can be analysed into the two elements (Operating profit margin and sales revenue to capital employed) for each of the years 2018 and 2019. What conclusions can you draw from your figures?arrow_forward
- Using the fiscal year end 2020 annual report for General Mills, Inc. and the figures from the 2020 annual report as noted below, calculate the financial ratios for 2020 and 2019 indicated using the EXCEL template provided:1. The average collection period 2.Days sales in inventory 3. debt to equity ratio 4. Times interest earned 5. Operating cash flow to Capital expenditures ratio 6. Earnings per share 7. Price earnings ratio 8. Dividend yield 9. Dividend payout ratio 10. Total assets 2020 = $30,806.7Total stockholders’ equity 2020 = $8,349.5Total current liabilities 2020 = $7,491.5Accounts receivable 2020 = $1,615.1Inventory 2020 = $1,426.3Year-end closing stock price May 2020 = $58.80Year-end closing stock price May 2019 = $53.56arrow_forwardI have attached their Consolidated Balance Sheets which reports assets, liabilities and shareholders’ equity as of December 31, 2019 and 2018. Required: Using the Abbott Lab’s balance sheet, answer the following: Which balance sheet line items would you use to evaluate the company’s liquidity, i.e., ability to meet short-term obligations and remain capable of dealing with unexpected opportunities or challenges. For both periods presented, compute “net working capital” for the periods presented. Net working capital = Current assets – Current liabilities Based on your computation, has Abbott’s net working capital improved or declined? Which balance sheet line items would you use to evaluate the company’s solvency, i.e. ability to meet long-term obligations, execute the company’s long-term strategic initiatives, and remain in business. For both periods presented, compute Abbott Lab’s “Debt-to-equity” ratio. Debt-to-equity = Total liabilities ÷ Total shareholders’ equity. Based on…arrow_forwardObtain Target Corporation's annual report for its 2018 fiscal year (year ended February 2, 2019) at http://investors.target.com a. What was Target's gross margin percentage for the fiscal year ended February 2, 2019 (2018) and 2017? Use "Sales" for these computations b. What was Target's Return on Sales percentage for 2018 and 2017? Use "Total Revenue" for these computations. c. Target's return on ales percentage for 2017 was higher than it was in 2018. Ignoring taxes, how much higher would Target's 2018 net income have been if it's return on sales percentage in 2018 had been the same as for 2017?arrow_forward
- Required: For each of the following accounts, what amount will Voltac report on its 2024 financial statements? a. Inventory b. Cost of goods sold c. Sales d. Accounts receivable e. Accounts payable f. Casharrow_forwardWith a given information below: (A) Prepare Income Statement and Balance Sheet in the Year 2020. (B) Analyze Income Statement and Balance Sheet in the Year 2020 Vertically. (C) Compute Financial Ratios: (1) ROE, (2) ROA, (3) Average Collection Period, (4) Debt to Asset, (5) Debt to Equity, (6) Time Interest Earned, (7) Total Assets Turnover, (8) Operating Profit Margin, (9) Return On Common Equity (ROCE), (10) Net Working Capital Ratio, (11) Quick Ratio, (12) Current Ratio. Cash $6,000 Sales $100,000 Utility Expense $8,000 Buildings $65,000 Common Stock $45,000 Accounts Payable $12,000 Supplies $4,000 Cost of Goods Sold $58,000 Interest Expense $5,000 Additional Paid in Capital $20,000 Bonds Payable $40,000 Supplies Expense $3,000 Salaries Expense $16,000 Accounts Receivable $10,000 Inventories $45,000 Retained Earnings $5,000 (beg. bal.) Income Tax Rate 20%arrow_forwardRequired information [The following information applies to the questions displayed below.] Selected comparative financial statements of Korbin Company follow. KORBIN COMPANY Comparative Income Statements For Years Ended December 31 2021 2020 $ $ 467,052 357,800 281,165 223,625 185,887 134, 175 66,321 49,376 42,035 31,486 108,356 80,862 77,531 53,313 14,421 10,929 $ $ 63,110 42,384 Sales Cost of goods sold Gross profit Selling expenses Administrative expenses Total expenses Income before taxes Income tax expense Net income KORBIN COMPANY Comparative Balance Sheets 2020 Assets Current assets Long-term investments Plant assets, net Total assets December 31 2021 Liabilities and Equity Current liabilities Common stock Other paid-in capital Retained earnings Total liabilities and equity Assets Current assets Long-term investments Plant assets, net Total assets Liabilities and Equity Current liabilities Common stock Other paid-in capital Retained earnings Total liabilities and equity 2019 $…arrow_forward
- Please complet the vertical analysis table and summurize your observations about changes in finacial trends, in the following income statement line items ( net sales, operting income and net earnings attributable to proter and gamble)arrow_forwardReview the Republic Financial Holdings Limited 2022 annual report. What recommendations can be made for the preparation of the financial statements ?arrow_forwardprovide reasons for the attached calculated ratios using GSK 2023 annual report and provide non-financail performance analysis examples for GSK 2023.arrow_forward
arrow_back_ios
SEE MORE QUESTIONS
arrow_forward_ios
Recommended textbooks for you
- Essentials Of InvestmentsFinanceISBN:9781260013924Author:Bodie, Zvi, Kane, Alex, MARCUS, Alan J.Publisher:Mcgraw-hill Education,


 Foundations Of FinanceFinanceISBN:9780134897264Author:KEOWN, Arthur J., Martin, John D., PETTY, J. WilliamPublisher:Pearson,
 Fundamentals of Financial Management (MindTap Cou...FinanceISBN:9781337395250Author:Eugene F. Brigham, Joel F. HoustonPublisher:Cengage Learning
 Corporate Finance (The Mcgraw-hill/Irwin Series i...FinanceISBN:9780077861759Author:Stephen A. Ross Franco Modigliani Professor of Financial Economics Professor, Randolph W Westerfield Robert R. Dockson Deans Chair in Bus. Admin., Jeffrey Jaffe, Bradford D Jordan ProfessorPublisher:McGraw-Hill Education
Essentials Of Investments
Finance
ISBN:9781260013924
Author:Bodie, Zvi, Kane, Alex, MARCUS, Alan J.
Publisher:Mcgraw-hill Education,
Foundations Of Finance
Finance
ISBN:9780134897264
Author:KEOWN, Arthur J., Martin, John D., PETTY, J. William
Publisher:Pearson,
Fundamentals of Financial Management (MindTap Cou...
Finance
ISBN:9781337395250
Author:Eugene F. Brigham, Joel F. Houston
Publisher:Cengage Learning
Corporate Finance (The Mcgraw-hill/Irwin Series i...
Finance
ISBN:9780077861759
Author:Stephen A. Ross Franco Modigliani Professor of Financial Economics Professor, Randolph W Westerfield Robert R. Dockson Deans Chair in Bus. Admin., Jeffrey Jaffe, Bradford D Jordan Professor
Publisher:McGraw-Hill Education