MATLAB: An Introduction with Applications
6th Edition
ISBN: 9781119256830
Author: Amos Gilat
Publisher: John Wiley & Sons Inc
expand_more
expand_more
format_list_bulleted
Question
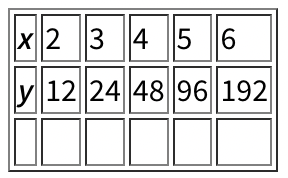
Create a
Then determine when a certain % of the original amount is reached based on your model/equation.

Transcribed Image Text:x2 3 4 5 6
y 12 24 48 96 192
Expert Solution
This question has been solved!
Explore an expertly crafted, step-by-step solution for a thorough understanding of key concepts.
Step by stepSolved in 2 steps with 1 images

Knowledge Booster
Similar questions
- Joe invests $500 in an account earning 6.5% interest compounded continuously. How long will it take for the amount in the account to reach $850? *Include 3 decimal places in your final answer*arrow_forwardNeda made a one-time deposit of $49,000.00 into a savings account that pays 2% annual interest compounded continuously. How much will the account be worth 5 years from when Neda made the deposit? Use the equation A = Pert to answer the question. Assume no additional deposits or withdrawals have occurred. Also assume the interest rate does not change while the account is open. Round your answer to the nearest cent. €arrow_forwardIn 1993, the cost of a painting was about $10. In 2002, the cost was $20. If the cost is growing exponentially, predict the cost of the painting in 2017. Round to the nearest cent. = _____arrow_forward
- Helparrow_forwardThe population of the village is expressed by the model y = 7800(1.25)3. Find the growth rate of the population.arrow_forwardAfter drinking a cup of coffee containing 100 mg of caffeine, caffeine leaves the body at a rate of 17% hourly compounded continuously. Write an equation that represents the amount of caffeine left in the body after t hours. How much caffeine is left in the body 8 hours after drinking this cup of coffee?arrow_forward
- The equation of the trend line is W = 30.94(1+0.00763)L. What is the growth rate of the trend line's equation? Express the growth rate as a percentage. Include units.arrow_forwardSolve the problem. An investment is worth $2429 in year 0, the initial investment year. By year 5 it’s value has increased to $5314. Let y be the value of the investment in the year x. Find and interpret the average rate of change in value per year.arrow_forwardThe equation below is used to calulate bacteria. Identify if it is a growth or decay and the percent of change. A = 600 (.72)“arrow_forward
arrow_back_ios
arrow_forward_ios
Recommended textbooks for you
 MATLAB: An Introduction with ApplicationsStatisticsISBN:9781119256830Author:Amos GilatPublisher:John Wiley & Sons Inc
 Probability and Statistics for Engineering and th...StatisticsISBN:9781305251809Author:Jay L. DevorePublisher:Cengage Learning
 Statistics for The Behavioral Sciences (MindTap C...StatisticsISBN:9781305504912Author:Frederick J Gravetter, Larry B. WallnauPublisher:Cengage Learning
 Elementary Statistics: Picturing the World (7th E...StatisticsISBN:9780134683416Author:Ron Larson, Betsy FarberPublisher:PEARSON
 The Basic Practice of StatisticsStatisticsISBN:9781319042578Author:David S. Moore, William I. Notz, Michael A. FlignerPublisher:W. H. Freeman
 Introduction to the Practice of StatisticsStatisticsISBN:9781319013387Author:David S. Moore, George P. McCabe, Bruce A. CraigPublisher:W. H. Freeman

MATLAB: An Introduction with Applications
Statistics
ISBN:9781119256830
Author:Amos Gilat
Publisher:John Wiley & Sons Inc

Probability and Statistics for Engineering and th...
Statistics
ISBN:9781305251809
Author:Jay L. Devore
Publisher:Cengage Learning

Statistics for The Behavioral Sciences (MindTap C...
Statistics
ISBN:9781305504912
Author:Frederick J Gravetter, Larry B. Wallnau
Publisher:Cengage Learning

Elementary Statistics: Picturing the World (7th E...
Statistics
ISBN:9780134683416
Author:Ron Larson, Betsy Farber
Publisher:PEARSON

The Basic Practice of Statistics
Statistics
ISBN:9781319042578
Author:David S. Moore, William I. Notz, Michael A. Fligner
Publisher:W. H. Freeman

Introduction to the Practice of Statistics
Statistics
ISBN:9781319013387
Author:David S. Moore, George P. McCabe, Bruce A. Craig
Publisher:W. H. Freeman