
MATLAB: An Introduction with Applications
6th Edition
ISBN: 9781119256830
Author: Amos Gilat
Publisher: John Wiley & Sons Inc
expand_more
expand_more
format_list_bulleted
Related questions
Concept explainers
Question
thumb_up100%

Transcribed Image Text:V.
MI
* 00
( (O
T
44
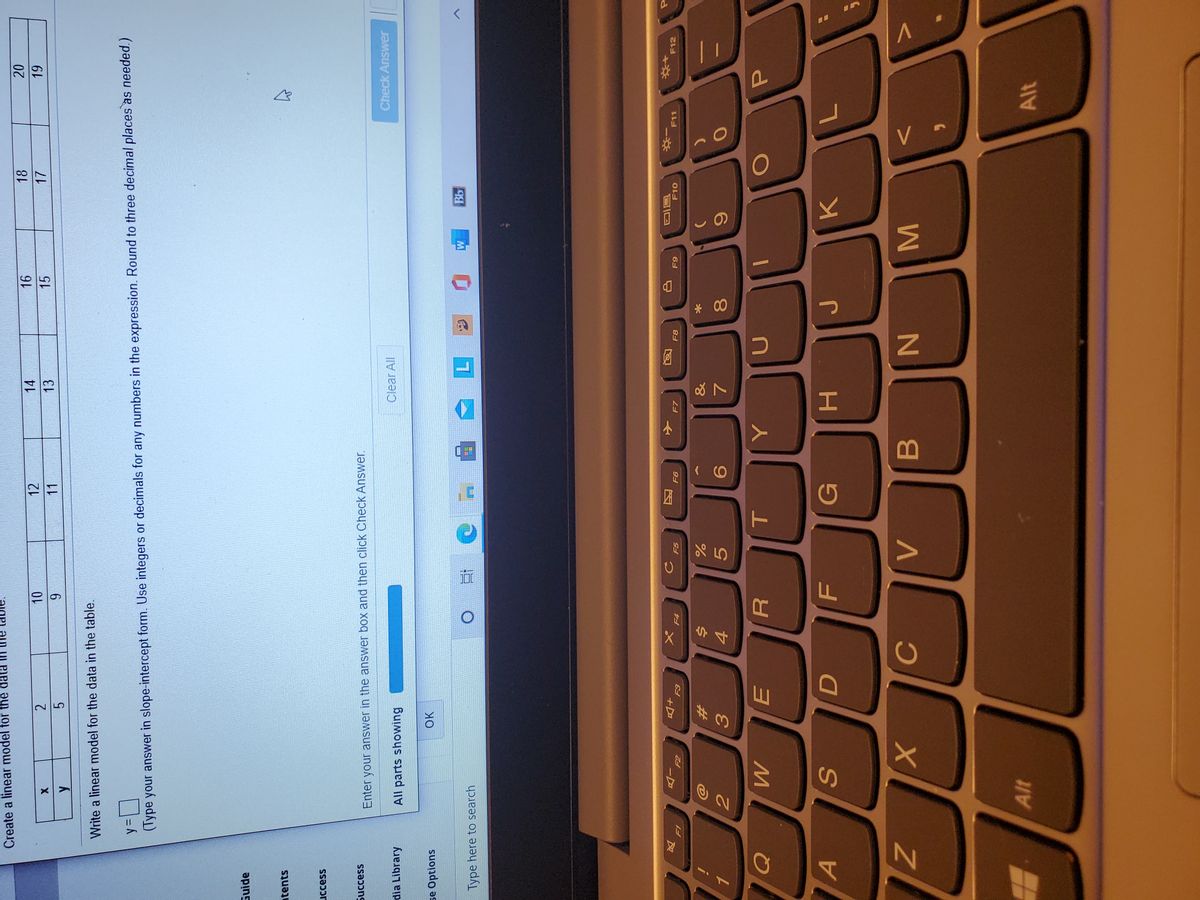
Create a linear model for the data
18
16.
15
12
14
2.
5.
20
11
13
6.
Write a linear model for the data in the table.
(Type your answer in slope-intercept form. Use integers or decimals for any numbers in the expression. Round to three decimal places as needed.)
Guide
tents
uccess
Success
Enter your answer in the answer box and then click Check Answer.
dia Library
All parts showing
Clear All
Check Answer
se Options
OK
Type here to search
直0
近
画回
反
+D
E3
-D
F4
F8
F10
F11
F12
6
&
%23
3.
A
N
Alt
Alt
Expert Solution
This question has been solved!
Explore an expertly crafted, step-by-step solution for a thorough understanding of key concepts.

Step by stepSolved in 2 steps with 3 images

Knowledge Booster


Learn more about
Need a deep-dive on the concept behind this application? Look no further. Learn more about this topic, statistics and related others by exploring similar questions and additional content below.Similar questions
- B-E. Please helparrow_forwardTell whether a linear model or a quadratic model is appropriate for the data. If linear, tell whether the slope should be positive or negative. If quadratic, decide whether the leading coefficient of x should be positive or negative. O A. linear, negative O B. quadratic; negative O C. quadratic; positive O D. linear; positive 3- 2- -5 43 2 2. 3 4 5 20 -4-arrow_forwardDarnell has recorded the estimated value of his car each year since 2017. Let x=1 correspond to the year 2017. Find the slope-intercept form of the equation for the line that passes through the points representing the value of his car in 2017, (1,24,349), and the value of his car in 2021, (5,17,999). Round the slope to the nearest hundredth, if necessary. Year Value, $$ 2017 24,349 2018 22,200 2019 20,100 2020 19,100 2021 17,999arrow_forward
- Write the equation of the line that passes through the points (9, 4) and (–6, –8). Put your answer in fully simplified point-slope form, unless it is a vertical or horizontal line.arrow_forwardFind the slope of the line represented by the data below. X -3 -2 -1 1 У 12 8 4 -4 Simplify completely. Slope = [?] Helparrow_forwardMany institutes, departments, and recruitment committees are using citations as part of the assessment process involved in making new appointments. By going through scientific databases like Scopusselection panels can check if a candidate’s work is making an impact by being cited by other researchers in their field. How does the scientific community measure how "good" or "great" a journal or an author is? How do you determine the "impact" of an author's work? The most 2common metric to track an author's impact is ask how often they are cited. The following table presents the number of citation on research publications of two Management Science professors over a period of 17years, 2005 to 2021, data taken from Google Scholar. The objective of this assignment is to find a suitable forecasting method (moving average, exponential smoothing, and/or simple linear regression model) to predict near future citation of a researcher. (a) For each professor, develop a scatter diagram on his…arrow_forward
arrow_back_ios
arrow_forward_ios
Recommended textbooks for you
- MATLAB: An Introduction with ApplicationsStatisticsISBN:9781119256830Author:Amos GilatPublisher:John Wiley & Sons Inc
 Probability and Statistics for Engineering and th...StatisticsISBN:9781305251809Author:Jay L. DevorePublisher:Cengage Learning
 Statistics for The Behavioral Sciences (MindTap C...StatisticsISBN:9781305504912Author:Frederick J Gravetter, Larry B. WallnauPublisher:Cengage Learning
  Elementary Statistics: Picturing the World (7th E...StatisticsISBN:9780134683416Author:Ron Larson, Betsy FarberPublisher:PEARSON
 The Basic Practice of StatisticsStatisticsISBN:9781319042578Author:David S. Moore, William I. Notz, Michael A. FlignerPublisher:W. H. Freeman
 Introduction to the Practice of StatisticsStatisticsISBN:9781319013387Author:David S. Moore, George P. McCabe, Bruce A. CraigPublisher:W. H. Freeman
MATLAB: An Introduction with Applications
Statistics
ISBN:9781119256830
Author:Amos Gilat
Publisher:John Wiley & Sons Inc
Probability and Statistics for Engineering and th...
Statistics
ISBN:9781305251809
Author:Jay L. Devore
Publisher:Cengage Learning
Statistics for The Behavioral Sciences (MindTap C...
Statistics
ISBN:9781305504912
Author:Frederick J Gravetter, Larry B. Wallnau
Publisher:Cengage Learning
Elementary Statistics: Picturing the World (7th E...
Statistics
ISBN:9780134683416
Author:Ron Larson, Betsy Farber
Publisher:PEARSON
The Basic Practice of Statistics
Statistics
ISBN:9781319042578
Author:David S. Moore, William I. Notz, Michael A. Fligner
Publisher:W. H. Freeman
Introduction to the Practice of Statistics
Statistics
ISBN:9781319013387
Author:David S. Moore, George P. McCabe, Bruce A. Craig
Publisher:W. H. Freeman