A First Course in Probability (10th Edition)
10th Edition
ISBN: 9780134753119
Author: Sheldon Ross
Publisher: PEARSON
expand_more
expand_more
format_list_bulleted
Question

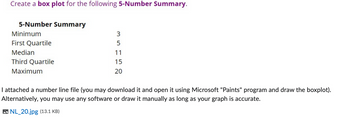
Transcribed Image Text:Create a box plot for the following 5-Number Summary.
5-Number Summary
Minimum
First Quartile
Median
Third Quartile
Maximum
35752
20
11
15
I attached a number line file (you may download it and open it using Microsoft "Paints" program and draw the boxplot).
Alternatively, you may use any software or draw it manually as long as your graph is accurate.
NL_20.jpg (13.1 KB)

Transcribed Image Text:+
+
+
+
0
1 2
3
4
LO
5
60
+
+
+
+
+
7
8
9
10
11
12 13
14
15 16
17
18
19 20
Expert Solution
This question has been solved!
Explore an expertly crafted, step-by-step solution for a thorough understanding of key concepts.
Step by stepSolved in 2 steps with 2 images

Knowledge Booster
Similar questions
- Please review Section 12.2. An agent for a residential real estate company in a suburb located outside a major city has the business objective of developing more accurate estimates of the monthly rental cost for apartments. Toward the goal, the agent would like to use the size of an apartment, as defined by square footage to predict the monthly rental cost. The agent selects a sample of 8 one-bedroom apartments and the data are shown. Size (Square Feet) Monthly Rent ($) 875 1500 850 1200 900 825 1150 1500 2000 1900 750 925 1250 1800 1100 1350 Construct a scatterplot. Size is the x value and Monthly Rent is the y value. You can hand-draw, or use technology...label appropriately. Use the least-squares method to determine the regression coefficients. If you use technology, include the documents or screen shots: bo (Round to one decimal place as needed.) (Round to one decimal place as needed.) bi =arrow_forwardplease use ms excelarrow_forwardIn paint technology, the sheen is the glossiness of a paint finish. Glossy paints are shiny and reflect most light in the specular (mirror-like) direction, while on flat paints most of the light diffuses in a range of angles. Gloss can be measured as a percentage. Carver Auto wants to use paints with over 85% gloss. Interpret SprayGo Red #5123 has 85% sheen with a margin of error of 3.5% This means SprayGo Red #5123 could have as little as Question Blank 1 of 2% or as much as Question Blank 2 of 2% gloss.arrow_forward
- Insert Draw Layout Review View B IU ab e A- A AClear Formatting 三三 Sensitivity 11 In 2014, Colorado was found to have a population of 5,355,866 and a land area of 103,642 square miles. Oklahoma has a land area of 68,594 square miles. Oklahoma's population density is known to be close to Colorado's. Use this information to estimate Oklahoma's population.arrow_forwardImage Attached Part 1 https://www.bartleby.com/questions-and-answers/a.-arrange-the-data-as-a-two-way-table-and-report-how-many-students-are-in-each-cell.-for-each-cell-/35516b17-6de0-4b10-a3c4-5bf693e4155d Fill in the missing responsesarrow_forwardPlease solve the question in the image asap. Here are the answer choices:arrow_forward
- Answer only 4 and 5 FOLLOW THE INSTRUCTIONS TYPEWRITTEN ONLY PLEASE FOR UPVOTE. DOWNVOTE FOR HANDWRITTEN. DO NOT ANSWER IF YOU ALREADY ANSWERED THISarrow_forwardplease create a summary of findings based on the graphical presentationarrow_forwardPlease answer the following including the conditions that need to be met and how to compute the answer using a graphing calculator. Thank you.arrow_forward
- Based on the box plot, what are the range and ther interquartile range?arrow_forwardWhen the measure of spread is compared between two data sets, data set A has an interquartile range of 12, and data set B has an interquartile range of 23. How do the values of data set A compare to data set B? The values of data set A are about the same on average as the values of data set B. The values of data set A are more spread out compared to the values of data set B. The values of data set A are less spread out compared to the values of data set B. The values of data set A are less on average compared to the values of data set B.arrow_forwardFile Edit View History Home - myRCC Frequency mylearning.suny.edu/d21/le/content/920969/viewContent/25846458/View -10 8 n= Data was collected for a sample of organic snacks. The amount of sugar (in mg) in each snack is summarized in the histogram below. 6 X 2 Bookmarks Profiles Tab Window Help A.1 HW-23FA STATISTICS (81 X 160 164 168 172 176 180 184 188 amount of sugar (mg) Q What is the sample size for this data set? Submit Question Question Help: Video b Enter your payment details | ba x + BUN SEP 15 MacBook Airarrow_forward
arrow_back_ios
SEE MORE QUESTIONS
arrow_forward_ios
Recommended textbooks for you
 A First Course in Probability (10th Edition)ProbabilityISBN:9780134753119Author:Sheldon RossPublisher:PEARSON

A First Course in Probability (10th Edition)
Probability
ISBN:9780134753119
Author:Sheldon Ross
Publisher:PEARSON
