
MATLAB: An Introduction with Applications
6th Edition
ISBN: 9781119256830
Author: Amos Gilat
Publisher: John Wiley & Sons Inc
expand_more
expand_more
format_list_bulleted
Related questions
Concept explainers
Topic Video
Question
Number 13

Transcribed Image Text:i webassign.net/web/Student/Assignment-Responses/last?dep=26339106
M Gmail Q Quizlet E Google Docs m HBO Max
N Netflix
D Disney+
h Hulu
a Amazon C
Apps Student - Samford..
13.
DETAILS
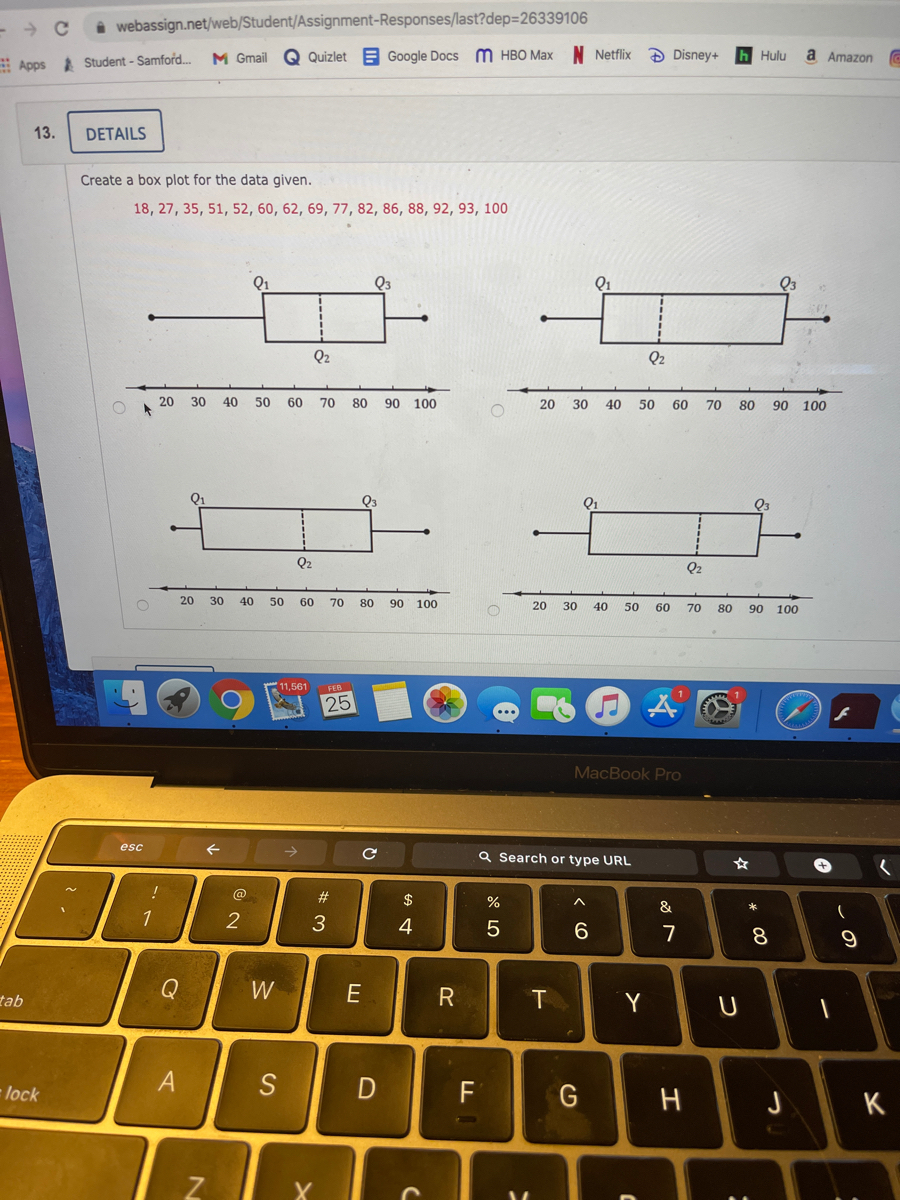
Create a box plot for the data given.
18, 27, 35, 51, 52, 60, 62, 69, 77, 82, 86, 88, 92, 93, 100
Q3
Q1
Q2
Q2
20
30
40
50
60
70
80
90 100
20 30
40
50
60
70
80
90 100
Q1
Q3
Q2
Q2
20
30
40
50
60
70
80
90 100
20
30
40
50
60
70
80
90 100
11,561
FEB
25
MacBook Pro
esc
Q Search or type URL
@
#
$
%
&
*
1
3
4
6.
8
tab
Y
A
D
F
G
lock
H
K
Expert Solution
This question has been solved!
Explore an expertly crafted, step-by-step solution for a thorough understanding of key concepts.

This is a popular solution

Trending nowThis is a popular solution!

Step by stepSolved in 2 steps with 1 images

Knowledge Booster


Learn more about
Need a deep-dive on the concept behind this application? Look no further. Learn more about this topic, statistics and related others by exploring similar questions and additional content below.Similar questions
- Transversals and Angle Measurements P Use the diagram to find all of the missing angles, knowing that a || b Z1 = 42 = 23 = 1= 3 2 54° 12 11 67° 10 7 8 9 4 6 5 a ➜barrow_forward-2 01 l3 -5 1. -3arrow_forwardConsumer Reports published their study of labeling of seafood sold. They purchased 190 random pieces of seafood from various kinds of food stores and restaurants and genetically compared the pieces to standard gene fragments that can identify the species. They found from laboratory results that 42 of these packages of seafood were mislabeled. Create a 95% confidence interval on seafood sold that is mislabeled. Show your work on paper. 1. put the standard error from your confidence interval you calculated. Round to 3 decimal places. 2. put the margin of error from your confidence interval you calculated. Round to 3 decimal places. 3. write a sentence stating the confidence interval you found and what it means in the context of this problem. (i.e. mention the word seafood)arrow_forward
arrow_back_ios
arrow_forward_ios
Recommended textbooks for you
- MATLAB: An Introduction with ApplicationsStatisticsISBN:9781119256830Author:Amos GilatPublisher:John Wiley & Sons Inc
 Probability and Statistics for Engineering and th...StatisticsISBN:9781305251809Author:Jay L. DevorePublisher:Cengage Learning
 Statistics for The Behavioral Sciences (MindTap C...StatisticsISBN:9781305504912Author:Frederick J Gravetter, Larry B. WallnauPublisher:Cengage Learning
  Elementary Statistics: Picturing the World (7th E...StatisticsISBN:9780134683416Author:Ron Larson, Betsy FarberPublisher:PEARSON
 The Basic Practice of StatisticsStatisticsISBN:9781319042578Author:David S. Moore, William I. Notz, Michael A. FlignerPublisher:W. H. Freeman
 Introduction to the Practice of StatisticsStatisticsISBN:9781319013387Author:David S. Moore, George P. McCabe, Bruce A. CraigPublisher:W. H. Freeman
MATLAB: An Introduction with Applications
Statistics
ISBN:9781119256830
Author:Amos Gilat
Publisher:John Wiley & Sons Inc
Probability and Statistics for Engineering and th...
Statistics
ISBN:9781305251809
Author:Jay L. Devore
Publisher:Cengage Learning
Statistics for The Behavioral Sciences (MindTap C...
Statistics
ISBN:9781305504912
Author:Frederick J Gravetter, Larry B. Wallnau
Publisher:Cengage Learning
Elementary Statistics: Picturing the World (7th E...
Statistics
ISBN:9780134683416
Author:Ron Larson, Betsy Farber
Publisher:PEARSON
The Basic Practice of Statistics
Statistics
ISBN:9781319042578
Author:David S. Moore, William I. Notz, Michael A. Fligner
Publisher:W. H. Freeman
Introduction to the Practice of Statistics
Statistics
ISBN:9781319013387
Author:David S. Moore, George P. McCabe, Bruce A. Craig
Publisher:W. H. Freeman