
MATLAB: An Introduction with Applications
6th Edition
ISBN: 9781119256830
Author: Amos Gilat
Publisher: John Wiley & Sons Inc
expand_more
expand_more
format_list_bulleted
Related questions
Concept explainers
Question
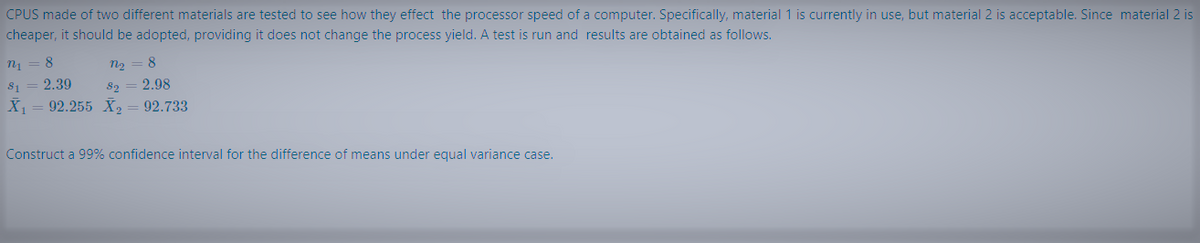

Transcribed Image Text:CPUS made of two different materials are tested to see how they effect the processor speed of a computer. Specifically, material 1 is currently in use, but material 2 is acceptable. Since material 2 is
cheaper, it should be adopted, providing it does not change the process yield. A test is run and results are obtained as follows.
n = 8
n, = 8
81
2.39
82
2.98
X1 = 92.255 X2 = 92.733
Construct a 99% confidence interval for the difference of means under equal variance case.
Expert Solution
This question has been solved!
Explore an expertly crafted, step-by-step solution for a thorough understanding of key concepts.

Step by stepSolved in 3 steps with 3 images

Knowledge Booster


Learn more about
Need a deep-dive on the concept behind this application? Look no further. Learn more about this topic, statistics and related others by exploring similar questions and additional content below.Similar questions
- 3.26. Three brands of batteries are under study. It is suspect- ed that the lives (in weeks) of the three brands are different. Five randomly selected batteries of each brand are tested with the following results: Brand 1 100 96 92 96 92 Weeks of Life Brand 2 76 80 75 84 82 Brand 3 108 100 96 98 100arrow_forwardA study was conducted in which two types of engines, X and Y, were compared. Gas mileage, in miles per gallon, was measured. Fifty experiments were conducted using engine type X and 75 experiments were done with engine type Y. The gasoline used and other conditions were held constant. The average gas mileage was 36 miles per gallon for engine X and 42 miles per gallon for engine Y. Find a 96% confidence interval on μY − μX, where μX and μY are population mean gas mileages for engines X and Y, respectively. Assume that the population standard deviations are 6 and 8 for engines X and Y, respectively.arrow_forwardPart 3. Assume that an advertisement claimed 32% of cellphone owners aged 18-24 have an android phone. Does the confidence interval contradict this claim? the confidence interval (a) does (b) does not contradict the claim because 0.32 (a)is (b) is not contained in the confarrow_forward
- Mechanical components are being produced continuously. A quality control program for the mechanical components requires a close estimate of the proportion defective in production when all settings are correct. 1020 components are examined under these conditions, and 27 of the 1020 items are found to be defective. (a) Find a point estimate of the proportion defective. (b) Find a 95% two-sided confidence interval. (c) Find an upper limit giving 95% level of confidence that the true proportion defective is less than this limiting value. Use Excel in parts (b) and (c).a need.arrow_forwardSuppose we are testing brake light reaction times for a new brake light design. The current design (we will call it the old design) is known to have an average reaction time of 0.8 seconds. A random sample of 50 drivers are tested on the new design, and the 50 drivers have an average reaction time of 0.76 seconds, with a 95% confidence interval of (0.66, 0.86) seconds. Write a few sentences to explain how we should interpret this data. Explain what the null hypothesis is here, whether we rejected the null, or failed to reject, and also what the implications are.arrow_forwardI'm confused with the R code, I'm supposed to do a 90% confidence interval at t=0.01.arrow_forward
- A study was conducted to determine if the percent of women who received financial aid is different form the percentage of men who receive financial aid. A random sample of students revealed the results shown in the table. Using (a=0.01), is there significant evidence to reject the null hypothesis? women men sample size number receiving aid 200 250. 300 225 a. Find the 90% confidence interval for the difference in financial aid rates between men and women and interpret this interval in the context of the problem. b. Write the two hypotheses for the problem. c. Compute the appropriate statistical hypothesis test and report the test statistic and p-value. d. Write the conclusion for the problem regarding the null hypothesis using statistical language.arrow_forwardA recent poll indicated that 42% of men supported raises taxes to fund additional park services. The poll also found that 64% of women supported such a tax. The sample consisted of 390 men and 420 women. Construct a 95% confidence interval around the difference in proportions.arrow_forwardA recent poll indicated that 42% of men supported raises taxes to fund additional park services. The poll also found that 64% of women supported such a tax. The sample consisted of 1300 men and 1350 women. Construct a 99% confidence interval around the difference in proportions.arrow_forward
- In a survey, 12001200 adults in a certain country were asked how many hours they worked in the previous week. Based on the results, a 95% confidence interval for mean number of hours worked was lower bound: 37.837.8 and upper bound: 39.539.5. Which of the following represents a reasonable interpretation of the result? For those that are not reasonable, explain the flaw. Complete parts (a) through (d) below.(a) There is a 95% chance the mean number of hours worked by adults in this country in the previous week was between 37.837.8 hours and 39.539.5 hours. A.Flawed. This interpretation implies that the population mean varies rather than the interval. B.Correct. This interpretation is reasonable. C.Flawed. This interpretation makes an implication about individuals rather than the mean. D.Flawed. This interpretation implies that the mean is only for last week. Click to select your answer and then click Check Answer.3arrow_forward17.18 4S overall mortality. The 4S study introduced in Exercise 17.17 also tallied deaths due to any cause. The treatment group experienced 182 deaths (n1 = 2221) and the control group experienced 256 deaths (n2 = 2223). Compare the mortality experience in the two groups in the form of a relative risk and 95% confidence interval.arrow_forwardProthrombin time is a measure of the clotting abil-ity of blood. For 10 rats treated with an antibiotic and 10 control rats, the prothrombin times (in seconds) werereported as follows: see photo (a) Construct a 90% confidence interval for the differencein population means. (Assume that the twopopulations from which the data came are normallydistributed.)(b) Why is it important that we assume that the twopopulations are normally distributed in part (a)? (c) Interpret the confidence interval from part (a) in thecontext of this setting.arrow_forward
arrow_back_ios
SEE MORE QUESTIONS
arrow_forward_ios
Recommended textbooks for you
- MATLAB: An Introduction with ApplicationsStatisticsISBN:9781119256830Author:Amos GilatPublisher:John Wiley & Sons Inc
 Probability and Statistics for Engineering and th...StatisticsISBN:9781305251809Author:Jay L. DevorePublisher:Cengage Learning
 Statistics for The Behavioral Sciences (MindTap C...StatisticsISBN:9781305504912Author:Frederick J Gravetter, Larry B. WallnauPublisher:Cengage Learning
  Elementary Statistics: Picturing the World (7th E...StatisticsISBN:9780134683416Author:Ron Larson, Betsy FarberPublisher:PEARSON
 The Basic Practice of StatisticsStatisticsISBN:9781319042578Author:David S. Moore, William I. Notz, Michael A. FlignerPublisher:W. H. Freeman
 Introduction to the Practice of StatisticsStatisticsISBN:9781319013387Author:David S. Moore, George P. McCabe, Bruce A. CraigPublisher:W. H. Freeman
MATLAB: An Introduction with Applications
Statistics
ISBN:9781119256830
Author:Amos Gilat
Publisher:John Wiley & Sons Inc
Probability and Statistics for Engineering and th...
Statistics
ISBN:9781305251809
Author:Jay L. Devore
Publisher:Cengage Learning
Statistics for The Behavioral Sciences (MindTap C...
Statistics
ISBN:9781305504912
Author:Frederick J Gravetter, Larry B. Wallnau
Publisher:Cengage Learning
Elementary Statistics: Picturing the World (7th E...
Statistics
ISBN:9780134683416
Author:Ron Larson, Betsy Farber
Publisher:PEARSON
The Basic Practice of Statistics
Statistics
ISBN:9781319042578
Author:David S. Moore, William I. Notz, Michael A. Fligner
Publisher:W. H. Freeman
Introduction to the Practice of Statistics
Statistics
ISBN:9781319013387
Author:David S. Moore, George P. McCabe, Bruce A. Craig
Publisher:W. H. Freeman