MATLAB: An Introduction with Applications
6th Edition
ISBN: 9781119256830
Author: Amos Gilat
Publisher: John Wiley & Sons Inc
expand_more
expand_more
format_list_bulleted
Question
thumb_up100%
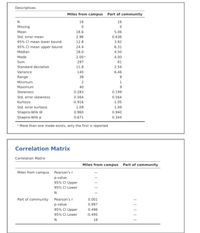
What does my output say about the Pearson

Transcribed Image Text:Descriptives
Miles from campus Part of community
16
16
Missing
Mean
18.6
5.06
Std. error mean
2.96
0.636
95% Cl mean lower bound
12.8
3.82
95% Cl mean upper bound
24.4
6.31
Median
18.0
4.50
Mode
2.00
4.00
Sum
297
81
Standard deviation
11.8
2.54
Variance
140
6.46
Range
38
8
Minimum
2
1
Maximum
40
Skewness
0.283
0.199
Std. error skewness
0.564
0.564
Kurtosis
-0.916
-1.05
Std. error kurtosis
1.09
1.09
Shapiro-Wilk W
0.960
0.940
Shapiro-Wilk p
0.671
0.344
• More than one mode exists, only the first is reported
Correlation Matrix
Correlation Matrix
Miles from campus Part of community
Miles from campus Pearson's r
p-value
95% CI Upper
95% CI Lower
N
Part of community Pearson's r
p-value
95% CI Upper
0.001
0.997
0.496
95% CI Lower
-0.495
N
16
|||| |

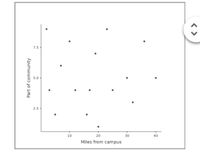
Transcribed Image Text:7.5
5.0-
2.5
10
20
30
40
Miles from campus
Part of community
< >
Expert Solution
This question has been solved!
Explore an expertly crafted, step-by-step solution for a thorough understanding of key concepts.
Step by stepSolved in 2 steps

Knowledge Booster
Similar questions
- You might expect the correlation between the horsepower of new cars and their gas mileages in miles per gallon to be: Group of answer choices A substantial negative correlation A substantial positive correlation A small correlationarrow_forwardI need help with this questionarrow_forwardSuppose that you are interested in the relationship between Reading and Writing scores. (a) Provide the scatterplot for the association between Reading and Writing scores. Based on the scatterplot, do you expect Reading to be correlated with Writing? If so, based only on the plot, would you expect the correlation to be positive or negative? Explain your answer. (b) Report the value of the correlation between Reading and Writing scores, and whether it is statistically significant. Do these results agree with your expectations from part (a)? RDG WRTG 34 44 47 36 42 59 39 41 36 49 50 46 63 65 44 52 47 41 44 50 50 62 44 41 47 40 42 59 42 41 47 41 60 65 39 49 57 54 73 65 47 46 39 44 35 39 39 41 48 49 31 41 52 63 47 54 36 44 47 44 34 46 52 57 42 40 37 44 44 33 71 58 47 46 42 33 42 36 47 41 52 54 52 54 39 39 31 41 60 54 47 31 39 28 42 36 47 57 42 49 36 41 50 33 34 34 55 55 28 46…arrow_forward
- A correlation coefficient provides two pieces of information about a relationship between two variables. These are -Strength; direction of relationship - Direction, proportions - Direction, which one causes which - Which one causes which, effect size. READ FIRST: Show as much of your work in the text box below as possible, and include the rest in your scratch work. Scratch work supports what you write on this exam form. At the minimum, type your answers to each of the following 5 questions A-E in the text box - do not refer me to your scratch work for the answers. Do show your work (on the exam form or scratch work) for the calculations needed to answer B, so partial credit can be given in the case of a math error that throws off your calculations. The best way to do this is inside tables if possible. Total 10 15 You conduct a survey to find out whether talking on a cell phone during a romantic date bothers people. You want to find out if there is a gender difference on this issue,…arrow_forwardExplain what correlation is and why two variables might be described as having a negative correlation. Age and education: A survey of U.S. adults showed that there is a negative correlation between age and education level. Does this mean that people become less educated as they become older? why or why not?arrow_forwardHello I need help with this one, calculate the Pearson product-moment correlations between at least two sets of variables in the Happiness and Engagement Dataset. Perform one correlation between two dependent variables. Perform the second correlation on an independent variable and the dependent variable OR between a different set of two dependent variables Calculate the Pearson product-moment correlations between the two sets of variables in your data set. Describe the correlations and their strength and direction.arrow_forward
- Explain what restriction of range is and what it tends to do to the magnitude of a correlation.arrow_forwardA researcher measures GPA and height for a group of high school students. What kind of correlation is likely to be obtained for these two variables?arrow_forwardThe data set provides a few measures from car models produced in the 1970s. We are focusing on Acceleration as the main outcome variable of interest in this analysis and we would like to examine other variables that may impact Acceleration. For exploring the relationships among the variables, run bivariate correlations for Engine, Horsepower, Weight, and Acceleration. Which variable has the strongest correlation with Acceleration (regardless of direction)?arrow_forward
- What does the sign and actual number tell you in a correlation?arrow_forwardThe correlation between autonomy (how independent and in control of their own decisions someone feels) and sleep disturbance is -0.327. Explain this correlation in terms of size and direction (note: use the actual variables in your explanation).arrow_forwardPlease explain each step clearly, and no excel formula should be used for solving this problemarrow_forward
arrow_back_ios
SEE MORE QUESTIONS
arrow_forward_ios
Recommended textbooks for you
 MATLAB: An Introduction with ApplicationsStatisticsISBN:9781119256830Author:Amos GilatPublisher:John Wiley & Sons Inc
 Probability and Statistics for Engineering and th...StatisticsISBN:9781305251809Author:Jay L. DevorePublisher:Cengage Learning
 Statistics for The Behavioral Sciences (MindTap C...StatisticsISBN:9781305504912Author:Frederick J Gravetter, Larry B. WallnauPublisher:Cengage Learning
 Elementary Statistics: Picturing the World (7th E...StatisticsISBN:9780134683416Author:Ron Larson, Betsy FarberPublisher:PEARSON
 The Basic Practice of StatisticsStatisticsISBN:9781319042578Author:David S. Moore, William I. Notz, Michael A. FlignerPublisher:W. H. Freeman
 Introduction to the Practice of StatisticsStatisticsISBN:9781319013387Author:David S. Moore, George P. McCabe, Bruce A. CraigPublisher:W. H. Freeman

MATLAB: An Introduction with Applications
Statistics
ISBN:9781119256830
Author:Amos Gilat
Publisher:John Wiley & Sons Inc

Probability and Statistics for Engineering and th...
Statistics
ISBN:9781305251809
Author:Jay L. Devore
Publisher:Cengage Learning

Statistics for The Behavioral Sciences (MindTap C...
Statistics
ISBN:9781305504912
Author:Frederick J Gravetter, Larry B. Wallnau
Publisher:Cengage Learning

Elementary Statistics: Picturing the World (7th E...
Statistics
ISBN:9780134683416
Author:Ron Larson, Betsy Farber
Publisher:PEARSON

The Basic Practice of Statistics
Statistics
ISBN:9781319042578
Author:David S. Moore, William I. Notz, Michael A. Fligner
Publisher:W. H. Freeman

Introduction to the Practice of Statistics
Statistics
ISBN:9781319013387
Author:David S. Moore, George P. McCabe, Bruce A. Craig
Publisher:W. H. Freeman