Contingency table results: Rows: Birth-Gender Columns: Crime-Focus Cell format Count (Row percent) (Percent of total) 1-Strongly Agree 2 -Moderately 3- Slightly Disagree Disagree 4-Neither Agree Nor Disagree 5- Slightly Agree 6- Moderately Agree Total 7-Strongly Agree 1 Male 2925 1285 610 850 1086 530 281 7567 (38.65%) (12.87%) (16.98%) (5.66%) (8.06%) (11.23%) (2.68%) (3.74%) (14.35%) (4.78%) (7%) (2.33%) (3.71%) (1.24%) (100%) (33.3%) 2 Female 7175 2759 1196 1414 1665 635 312 15156 (47.34%) (18.2%) (7.89%) (9.33%) (10.99%) (4.19%) (2.06%) (100%) (31.58%) (12.14%) (5.26%) (6.22%) (7.33%) (2.79%) (1.37%) (66.7%) Total 10100 (44.45%) 4044 1806 2264 2751 1165 593 22723 (17.8%) (7.95%) (9.96%) (12.11%) (44.45%) (17.8%) (7.95%) (9.96%) (12.11%) (5.13%) (5.13%) (2.61%) (100%) (2.61%) (100%) Chi-Square test: Statistic DF Value P-value Chi-square 6 286.61966 <0.0001 1. Interpret the expected counts for each response in the "Neither agree nor disagree" column of your table. No need to show how the expected counts were calculated, but each interpretation should include a relevant percentage. 2. Determine whether conditions are met to use the chi-square test of independence. For each condition explain why the condition is met or not met. 3. If conditions are met, use the StatCrunch chi-square output (included with your contingency table) to state your conclusion in context. If conditions are not met, write "Conditions are not met, so we cannot use the chi-square test of independence to investigate whether birth gender is related to participants' attitudes about law enforcement's crime focus."
Contingency table results: Rows: Birth-Gender Columns: Crime-Focus Cell format Count (Row percent) (Percent of total) 1-Strongly Agree 2 -Moderately 3- Slightly Disagree Disagree 4-Neither Agree Nor Disagree 5- Slightly Agree 6- Moderately Agree Total 7-Strongly Agree 1 Male 2925 1285 610 850 1086 530 281 7567 (38.65%) (12.87%) (16.98%) (5.66%) (8.06%) (11.23%) (2.68%) (3.74%) (14.35%) (4.78%) (7%) (2.33%) (3.71%) (1.24%) (100%) (33.3%) 2 Female 7175 2759 1196 1414 1665 635 312 15156 (47.34%) (18.2%) (7.89%) (9.33%) (10.99%) (4.19%) (2.06%) (100%) (31.58%) (12.14%) (5.26%) (6.22%) (7.33%) (2.79%) (1.37%) (66.7%) Total 10100 (44.45%) 4044 1806 2264 2751 1165 593 22723 (17.8%) (7.95%) (9.96%) (12.11%) (44.45%) (17.8%) (7.95%) (9.96%) (12.11%) (5.13%) (5.13%) (2.61%) (100%) (2.61%) (100%) Chi-Square test: Statistic DF Value P-value Chi-square 6 286.61966 <0.0001 1. Interpret the expected counts for each response in the "Neither agree nor disagree" column of your table. No need to show how the expected counts were calculated, but each interpretation should include a relevant percentage. 2. Determine whether conditions are met to use the chi-square test of independence. For each condition explain why the condition is met or not met. 3. If conditions are met, use the StatCrunch chi-square output (included with your contingency table) to state your conclusion in context. If conditions are not met, write "Conditions are not met, so we cannot use the chi-square test of independence to investigate whether birth gender is related to participants' attitudes about law enforcement's crime focus."

MATLAB: An Introduction with Applications
6th Edition
ISBN:9781119256830
Author:Amos Gilat
Publisher:Amos Gilat
Chapter1: Starting With Matlab
Section: Chapter Questions
Problem 1P

Related questions
Question
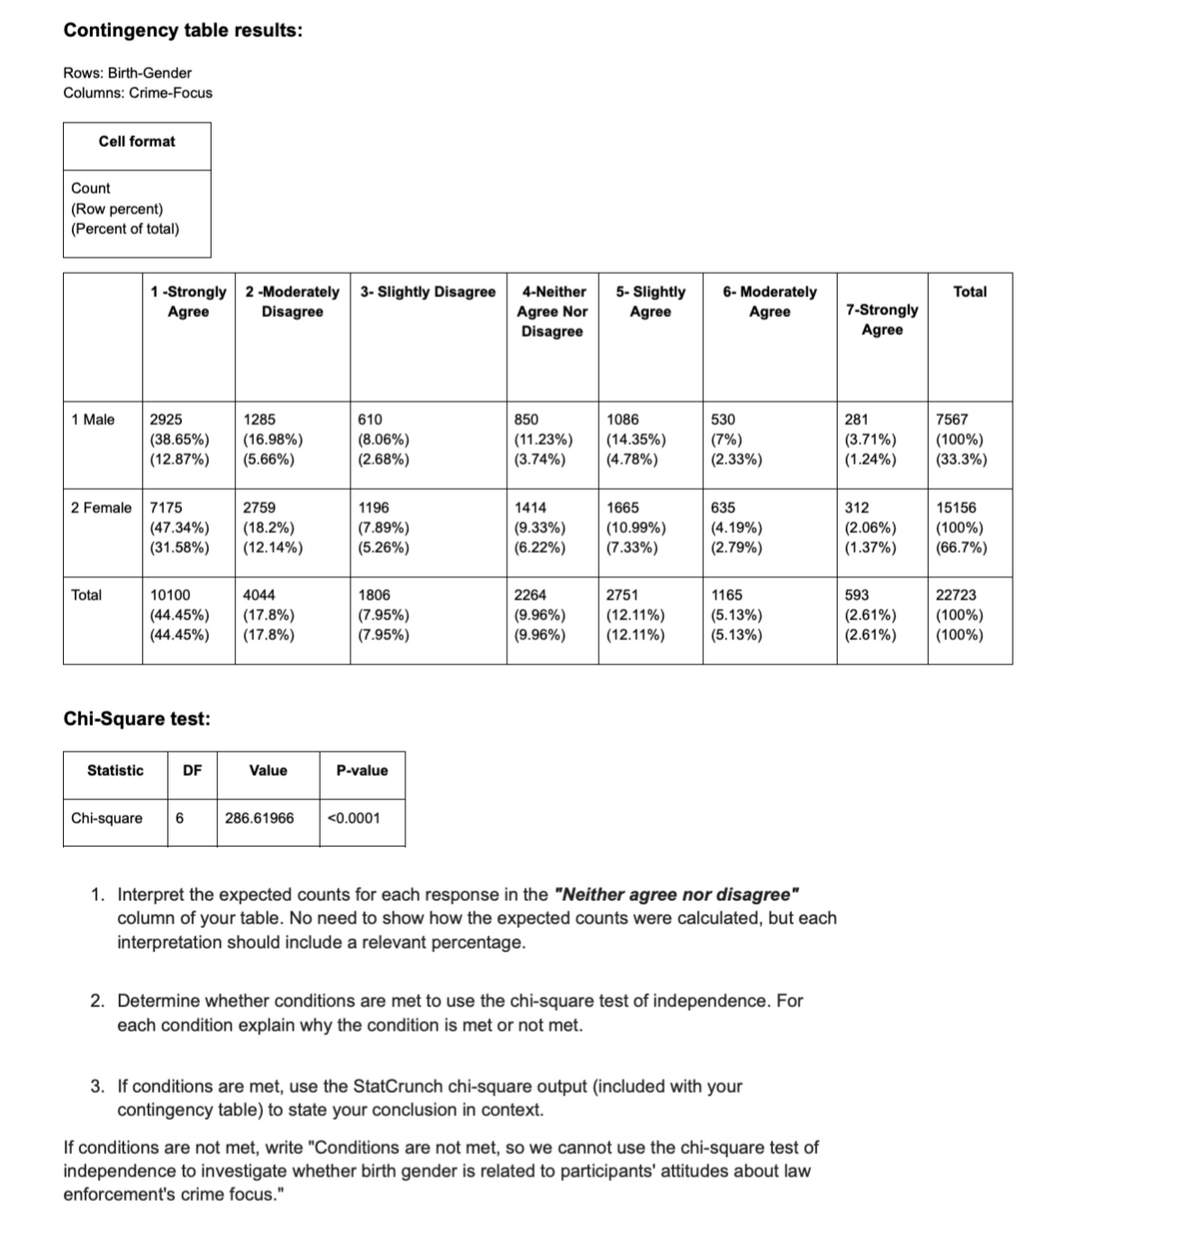
Transcribed Image Text:Contingency table results:
Rows: Birth-Gender
Columns: Crime-Focus
Cell format
Count
(Row percent)
(Percent of total)
1-Strongly
Agree
2 -Moderately 3- Slightly Disagree
Disagree
4-Neither
Agree Nor
Disagree
5- Slightly
Agree
6- Moderately
Agree
Total
7-Strongly
Agree
1 Male
2925
1285
610
850
1086
530
281
7567
(38.65%)
(12.87%)
(16.98%)
(5.66%)
(8.06%)
(11.23%)
(2.68%)
(3.74%)
(14.35%)
(4.78%)
(7%)
(2.33%)
(3.71%)
(1.24%)
(100%)
(33.3%)
2 Female 7175
2759
1196
1414
1665
635
312
15156
(47.34%)
(18.2%)
(7.89%)
(9.33%)
(10.99%)
(4.19%)
(2.06%)
(100%)
(31.58%)
(12.14%)
(5.26%)
(6.22%)
(7.33%)
(2.79%)
(1.37%)
(66.7%)
Total
10100
(44.45%)
4044
1806
2264
2751
1165
593
22723
(17.8%)
(7.95%)
(9.96%)
(12.11%)
(44.45%) (17.8%)
(7.95%)
(9.96%)
(12.11%)
(5.13%)
(5.13%)
(2.61%) (100%)
(2.61%)
(100%)
Chi-Square test:
Statistic
DF
Value
P-value
Chi-square 6
286.61966
<0.0001
1. Interpret the expected counts for each response in the "Neither agree nor disagree"
column of your table. No need to show how the expected counts were calculated, but each
interpretation should include a relevant percentage.
2. Determine whether conditions are met to use the chi-square test of independence. For
each condition explain why the condition is met or not met.
3. If conditions are met, use the StatCrunch chi-square output (included with your
contingency table) to state your conclusion in context.
If conditions are not met, write "Conditions are not met, so we cannot use the chi-square test of
independence to investigate whether birth gender is related to participants' attitudes about law
enforcement's crime focus."
AI-Generated Solution

Unlock instant AI solutions
Tap the button
to generate a solution
Recommended textbooks for you
MATLAB: An Introduction with Applications
Statistics
ISBN:
9781119256830
Author:
Amos Gilat
Publisher:
John Wiley & Sons Inc

Probability and Statistics for Engineering and th…
Statistics
ISBN:
9781305251809
Author:
Jay L. Devore
Publisher:
Cengage Learning

Statistics for The Behavioral Sciences (MindTap C…
Statistics
ISBN:
9781305504912
Author:
Frederick J Gravetter, Larry B. Wallnau
Publisher:
Cengage Learning
MATLAB: An Introduction with Applications
Statistics
ISBN:
9781119256830
Author:
Amos Gilat
Publisher:
John Wiley & Sons Inc
Probability and Statistics for Engineering and th…
Statistics
ISBN:
9781305251809
Author:
Jay L. Devore
Publisher:
Cengage Learning
Statistics for The Behavioral Sciences (MindTap C…
Statistics
ISBN:
9781305504912
Author:
Frederick J Gravetter, Larry B. Wallnau
Publisher:
Cengage Learning

Elementary Statistics: Picturing the World (7th E…
Statistics
ISBN:
9780134683416
Author:
Ron Larson, Betsy Farber
Publisher:
PEARSON

The Basic Practice of Statistics
Statistics
ISBN:
9781319042578
Author:
David S. Moore, William I. Notz, Michael A. Fligner
Publisher:
W. H. Freeman

Introduction to the Practice of Statistics
Statistics
ISBN:
9781319013387
Author:
David S. Moore, George P. McCabe, Bruce A. Craig
Publisher:
W. H. Freeman