
MATLAB: An Introduction with Applications
6th Edition
ISBN: 9781119256830
Author: Amos Gilat
Publisher: John Wiley & Sons Inc
expand_more
expand_more
format_list_bulleted
Related questions
Question
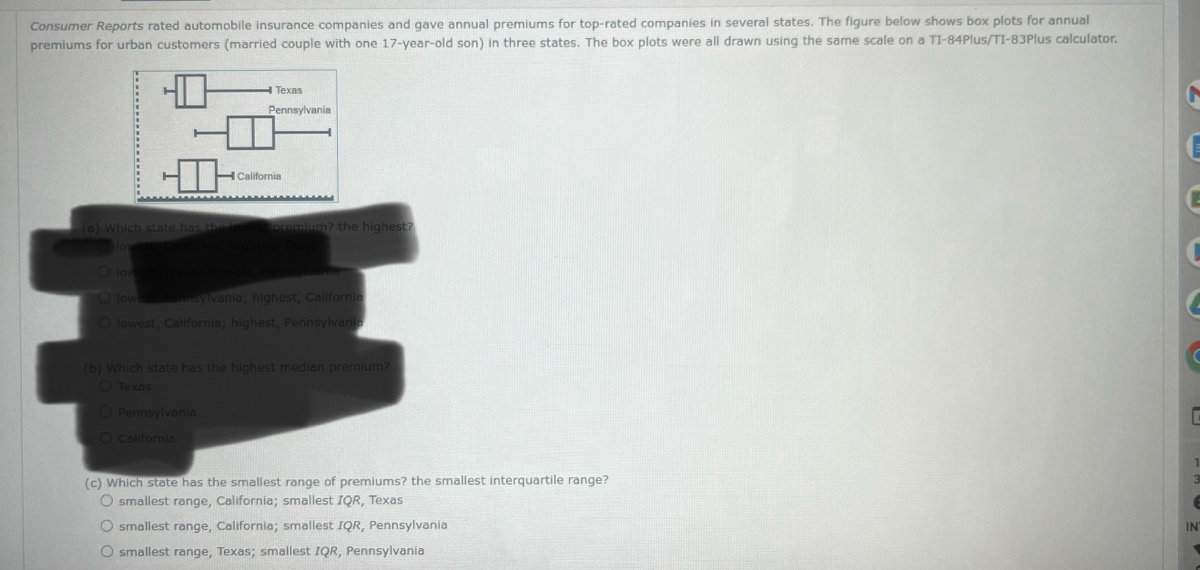

Transcribed Image Text:Consumer Reports rated automobile insurance companies and gave annual premiums for top-rated companies in several states. The figure below shows box plots for annual
premiums for urban customers (married couple with one 17-year-old son) in three states. The box plots were all drawn using the same scale on a TI-84Plus/TI-83Plus calculator.
(a) Which state has the
Texas
Pennsylvania
O Pennsylvania
O California
California
premium? the highest?
O lowest T
O lowest, Pennsylvania; highest, California
O lowest, California; highest, Pennsylvania
(b) Which state has the highest median premium?
O Texas
(c) which state has the smallest range of premiums? the smallest interquartile range?
O smallest range, California; smallest IQR, Texas
O smallest range, California; smallest IQR, Pennsylvania
O smallest range, Texas; smallest IQR, Pennsylvania
6
IN
Expert Solution
This question has been solved!
Explore an expertly crafted, step-by-step solution for a thorough understanding of key concepts.

This is a popular solution

Trending nowThis is a popular solution!

Step by stepSolved in 2 steps with 1 images

Knowledge Booster

Similar questions
- Please check answers 1; 0.351 2; 0.060 3;0.205 4; 0.172arrow_forwardThe FBI wants to determine the effectiveness of their 10 Most Wanted list. To do so, they need to find out the fraction of people who appear on the list that are actually caught. Step 1 of 2 : Suppose a sample of 716 suspected criminals is drawn. Of these people, 279 were captured. Using the data, estimate the proportion of people who were caught after being on the 10 Most Wanted list. Enter your answer as a fraction or a decimal number rounded to three decimal places.arrow_forwardA recent poll of 2940 corporate executives showed that the average price of their cars is $31,800 is this a population parameter or a sample statstic and why?arrow_forward
- The FBI wants to determine the effectiveness of their 10 Most Wanted list. To do so, they need to find out the fraction of people who appear on the list that are actually caught. Step 1 of 2: Suppose a sample of 233 suspected criminals is drawn. Of these people, 72 were captured. Using the data, estimate the proportion of people who were caught after being on the 10 Most Wanted list. Enter your answer as a fraction or a decimal number rounded to three decimal places. Step 2 of 2: Suppose a sample of 233 suspected criminals is drawn. Of these people, 72 were captured. Using the data, construct the 80% confidence interval for the population proportion of people who are captured after appearing on the 10 Most Wanted list. Round your answers to three decimal places.arrow_forwardThe American Heart Association is about to conduct an anti-smoking campaign and wants to know the fraction of Americans over 33 who smoke. step 1 of 2: suppose a sample of 1267 Americans over 33 is drawn. Of these people, 913 don't smoke. Using the data, estimate the proportion of Americans over 33 who smoke. Enter your answer as a decimal number rounded to three decimal places.arrow_forwardEstimate the following percentages without using a calculator. 10.1% of 7,800 is 0.99% of 83,583 is 20% of 5,008,340 is 0.52% of 472,028 isarrow_forward
- DuPont Automotive releases a Color Popularity Report which provides the percentages of car colors in North America. The most recent report is shown in the following table.arrow_forwardRichard’s doctor had told him he needed to keep track of his blood sugar readings. Listed below are his 20 latest readings. He wanted to create a visual aid for himself in order to see how his blood sugar was doing. 75 125 110 82 178 209 150 130 120 142 90 98 107 163 135 129 147 152 110 100 A. Create a frequency distribution table for the given data set. B. Create a histogram for the data set. C. Describe the distribution of the data.arrow_forwardThe FBI wants to determine the effectiveness of their 10 Most Wanted list. To do so, they need to find out the fraction of people who appear on the list that are actually caught. Step 1 of 2: Suppose a sample of 1453 suspected criminals is drawn. Of these people, 392 were captured. Using the data, estimate the proportion of people who were caught after being on the 10 Most Wanted list. Enter your answer as a fraction or a decimal number rounded to three decimal places.arrow_forward
- I can't understand why the data is the percentage of surveyed parents.arrow_forwardThe state education commission wants to estimate the fraction of tenth-grade students that have reading skills at or below the eighth-grade level. Step 1 of 2 : Suppose a sample of 1134 tenth graders is drawn. Of the students sampled, 226 read at or below the eighth-grade level. Using the data, estimate the proportion of tenth graders reading at or below the eighth-grade level. Enter your answer as a fraction or a decimal number rounded to three decimal places.arrow_forwardIn an insurance company study of the causes of 1,000 deaths, these data were obtained. Draw a pie chart to represent the data. Cause of Death Number of Deaths Heart disease 432 Cancer 227 Stroke 93 Accidents 24 Other 224 Total 1,000arrow_forward
arrow_back_ios
SEE MORE QUESTIONS
arrow_forward_ios
Recommended textbooks for you
- MATLAB: An Introduction with ApplicationsStatisticsISBN:9781119256830Author:Amos GilatPublisher:John Wiley & Sons Inc
 Probability and Statistics for Engineering and th...StatisticsISBN:9781305251809Author:Jay L. DevorePublisher:Cengage Learning
 Statistics for The Behavioral Sciences (MindTap C...StatisticsISBN:9781305504912Author:Frederick J Gravetter, Larry B. WallnauPublisher:Cengage Learning
  Elementary Statistics: Picturing the World (7th E...StatisticsISBN:9780134683416Author:Ron Larson, Betsy FarberPublisher:PEARSON
 The Basic Practice of StatisticsStatisticsISBN:9781319042578Author:David S. Moore, William I. Notz, Michael A. FlignerPublisher:W. H. Freeman
 Introduction to the Practice of StatisticsStatisticsISBN:9781319013387Author:David S. Moore, George P. McCabe, Bruce A. CraigPublisher:W. H. Freeman
MATLAB: An Introduction with Applications
Statistics
ISBN:9781119256830
Author:Amos Gilat
Publisher:John Wiley & Sons Inc
Probability and Statistics for Engineering and th...
Statistics
ISBN:9781305251809
Author:Jay L. Devore
Publisher:Cengage Learning
Statistics for The Behavioral Sciences (MindTap C...
Statistics
ISBN:9781305504912
Author:Frederick J Gravetter, Larry B. Wallnau
Publisher:Cengage Learning
Elementary Statistics: Picturing the World (7th E...
Statistics
ISBN:9780134683416
Author:Ron Larson, Betsy Farber
Publisher:PEARSON
The Basic Practice of Statistics
Statistics
ISBN:9781319042578
Author:David S. Moore, William I. Notz, Michael A. Fligner
Publisher:W. H. Freeman
Introduction to the Practice of Statistics
Statistics
ISBN:9781319013387
Author:David S. Moore, George P. McCabe, Bruce A. Craig
Publisher:W. H. Freeman