MATLAB: An Introduction with Applications
6th Edition
ISBN: 9781119256830
Author: Amos Gilat
Publisher: John Wiley & Sons Inc
expand_more
expand_more
format_list_bulleted
Question
Constructing a Confidence Interval for a Population
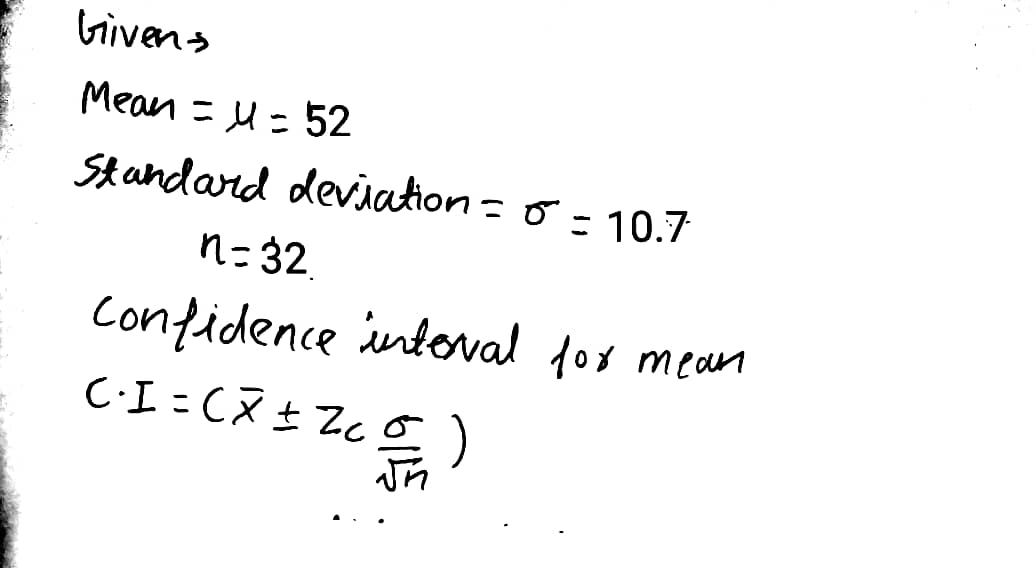
You measure 32 textbooks' weights, and find they have a mean weight of 52 ounces. Assume the population standard deviation is 10.7 ounces. Based on this, construct a 95% confidence interval for the true population mean textbook weight.
Give your answers as decimals, rounded to two decimal places.
_____________< μμ < __________
Expert Solution
arrow_forward
Step 1

Step by stepSolved in 2 steps with 2 images

Knowledge Booster
Similar questions
- you measure 26 textbooks weights and find they have a mean weight of 37 ounces. assume the population standard deviation is 9.1 ounces based on this construct a 90% confidence interval for the true population mean textbook weight. give your answers as decimals to two places ____________<u<___________arrow_forwardI need help with all parts of this question 22arrow_forwardWe wish to estimate what percent of adult residents in a certain county are parents. Out of 200 adult residents sampled, 58 had kids. Based on this, construct a 95% confidence interval for the proportion p of adult residents who are parents in this county. Express your answer in tri-inequality form. Give your answers as decimals, to three places. __________< p <_________ Express the same answer using the point estimate and margin of error. Give your answers as decimals, to three places. p = _______ ± ___________arrow_forward
- You review your data from a population A and population B. The mean and standard deviation are noted as N(mean, standard deviation). NA(400,10) and NB(300,25). 95 percent of the observations for population A exceed a value of___________?95 percent of the observations for population B are less than a value of _____________?arrow_forwardSolve this for mearrow_forwardUsing the square root of x sign above, you will be able to find symbols and equations. Subscripts are also at the top. X2 X2 Now that you have calculated SS. Calculate variance and standard deviation using the same distribution of scores from a population. 3, 7, 8, 5, 6, 4, 9, 10, 7, 8, 6, 5arrow_forward
- help pleasearrow_forwardIQ tests supposedly measure our intelligence. They typically are ‘normed’ so that they have a mean of 100 and a standard deviation of 15. (Higher scores show higher intelligence.) Use the graph and use the z-score and percents from columns b and c in Table A, when relevant. If you scored 132, what is your z-score? (Interpret.) Use table A X, z(a), (b), and (c) X z (a) (b) (c) and use the graph! Write down or save your response to use in Part 2 of this quiz. Group of answer choices -2.53 z. I'm at the 98.34 percentile rank and 1.66% of people scored smarter than me. 2.13 z. I'm at the 98.34 percentile rank and 1.66% of people scored smarter than me. -2.13 z. I'm at the 1.66 percentile rank and 98.34% of people scored smarter than me. 2.53 z. I'm at the 0.57 percentile rank and 99.43% of people scored smarter than me. 2.13 z. I'm at the 1.66 percentile rank and 98.34% of people scored smarter than me. 2.53 z. I'm at the 99.43 percentile rank…arrow_forwardplease answer in text form and in proper format answer with must explanation , calculation for each part and steps clearlyarrow_forward
arrow_back_ios
arrow_forward_ios
Recommended textbooks for you
 MATLAB: An Introduction with ApplicationsStatisticsISBN:9781119256830Author:Amos GilatPublisher:John Wiley & Sons Inc
 Probability and Statistics for Engineering and th...StatisticsISBN:9781305251809Author:Jay L. DevorePublisher:Cengage Learning
 Statistics for The Behavioral Sciences (MindTap C...StatisticsISBN:9781305504912Author:Frederick J Gravetter, Larry B. WallnauPublisher:Cengage Learning
 Elementary Statistics: Picturing the World (7th E...StatisticsISBN:9780134683416Author:Ron Larson, Betsy FarberPublisher:PEARSON
 The Basic Practice of StatisticsStatisticsISBN:9781319042578Author:David S. Moore, William I. Notz, Michael A. FlignerPublisher:W. H. Freeman
 Introduction to the Practice of StatisticsStatisticsISBN:9781319013387Author:David S. Moore, George P. McCabe, Bruce A. CraigPublisher:W. H. Freeman

MATLAB: An Introduction with Applications
Statistics
ISBN:9781119256830
Author:Amos Gilat
Publisher:John Wiley & Sons Inc

Probability and Statistics for Engineering and th...
Statistics
ISBN:9781305251809
Author:Jay L. Devore
Publisher:Cengage Learning

Statistics for The Behavioral Sciences (MindTap C...
Statistics
ISBN:9781305504912
Author:Frederick J Gravetter, Larry B. Wallnau
Publisher:Cengage Learning

Elementary Statistics: Picturing the World (7th E...
Statistics
ISBN:9780134683416
Author:Ron Larson, Betsy Farber
Publisher:PEARSON

The Basic Practice of Statistics
Statistics
ISBN:9781319042578
Author:David S. Moore, William I. Notz, Michael A. Fligner
Publisher:W. H. Freeman

Introduction to the Practice of Statistics
Statistics
ISBN:9781319013387
Author:David S. Moore, George P. McCabe, Bruce A. Craig
Publisher:W. H. Freeman