
MATLAB: An Introduction with Applications
6th Edition
ISBN: 9781119256830
Author: Amos Gilat
Publisher: John Wiley & Sons Inc
expand_more
expand_more
format_list_bulleted
Related questions
Topic Video
Question
thumb_up100%
![**Confidence Interval Construction Using the t-Distribution**
**Problem Statement:**
Construct the indicated confidence interval for the population mean (μ) using the t-distribution. Assume the population is normally distributed.
- Confidence level (c) = 0.95
- Sample mean (\( \bar{x} \)) = 12.6
- Sample standard deviation (s) = 3.0
- Sample size (n) = 10
**Confidence Interval:**
\[ (\_, \_) \]
**Instructions:**
Round to one decimal place as needed.
**Understanding Confidence Intervals:**
A confidence interval provides a range of values that is likely to contain the population mean (μ) with a certain level of confidence. When the population standard deviation is unknown and the sample size is small (typically n < 30), the t-distribution is more appropriate than the normal distribution for constructing the interval. Here, we use a 95% confidence level, which means we are 95% confident that the interval calculated from the sample data contains the true population mean.
To calculate the confidence interval, you would generally follow these steps:
1. Determine the t-score for your confidence level and degrees of freedom (df = n - 1).
2. Calculate the standard error (SE) of the mean: SE = s / √n.
3. Calculate the margin of error (ME): ME = t-score * SE.
4. Determine the confidence interval: ( \( \bar{x} \) - ME, \( \bar{x} \) + ME ).
**Note:** Provide actual values in place of placeholders after computation.](https://content.bartleby.com/qna-images/question/09fc76f0-690c-4548-a807-d9841947f510/a4be107c-f5ea-49a9-900d-0832e96a0595/v8ummil_processed.png)

Transcribed Image Text:**Confidence Interval Construction Using the t-Distribution**
**Problem Statement:**
Construct the indicated confidence interval for the population mean (μ) using the t-distribution. Assume the population is normally distributed.
- Confidence level (c) = 0.95
- Sample mean (\( \bar{x} \)) = 12.6
- Sample standard deviation (s) = 3.0
- Sample size (n) = 10
**Confidence Interval:**
\[ (\_, \_) \]
**Instructions:**
Round to one decimal place as needed.
**Understanding Confidence Intervals:**
A confidence interval provides a range of values that is likely to contain the population mean (μ) with a certain level of confidence. When the population standard deviation is unknown and the sample size is small (typically n < 30), the t-distribution is more appropriate than the normal distribution for constructing the interval. Here, we use a 95% confidence level, which means we are 95% confident that the interval calculated from the sample data contains the true population mean.
To calculate the confidence interval, you would generally follow these steps:
1. Determine the t-score for your confidence level and degrees of freedom (df = n - 1).
2. Calculate the standard error (SE) of the mean: SE = s / √n.
3. Calculate the margin of error (ME): ME = t-score * SE.
4. Determine the confidence interval: ( \( \bar{x} \) - ME, \( \bar{x} \) + ME ).
**Note:** Provide actual values in place of placeholders after computation.
Expert Solution
arrow_forward
Step 1
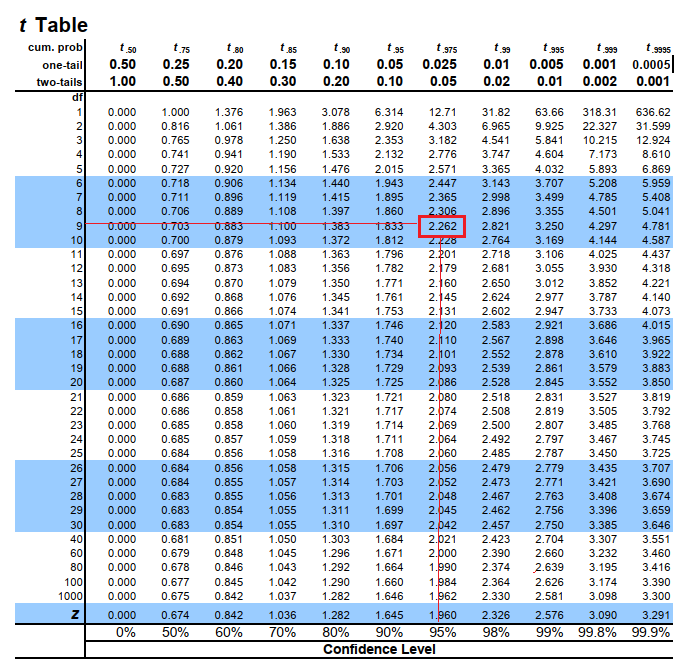
Since population standard deviation is unknown, Use t-distribution to find t-critical value.
Find the t-critical value:
Refer t-distribution table and look for t value corresponding to degrees of freedom=9 & confidence level of 95%.
Therefore,

Step by stepSolved in 2 steps with 15 images

Knowledge Booster


Learn more about
Need a deep-dive on the concept behind this application? Look no further. Learn more about this topic, statistics and related others by exploring similar questions and additional content below.Similar questions
- Find the 80% confidence intervals for the variance and standard deviation of the ages of seniors at Oak Park College if a random sample of 28 students have a standard deviation of 2 years. Assume the variable is normally distributed. Use the chi-square distribution table to find any chi-square values to three decimal places. Round the final answers to one decimal place.arrow_forwardSuppose X, the grade on a midterm exam, is normally distributed with mean 80 and standard deviation 10. The instructor wants to give 15% of the class an A. What cutoff should the instructor use to determine who gets an A?arrow_forwardUse the given degree of confidence and sample data to construct a confidence interval for the population mean μ . Assume that the population has a normal distribution. n=10, x=8.1, s=4.8, 95% confidencearrow_forward
- Use the given data to find the 95% confidence interval estiate of the population mean ?μ. Assume that the population has a normal distribution. IQ scores of professional athletes:Sample size n=20Mean =106Standard deviation ?=9 ? <?< ?arrow_forwardThe average American gets a haircut every 35 days. Is the average smaller for college students? The data includes the results of a survey of 11 college students asking them how many days elapse between haircuts. Assume that the distribution of the population is normal. Suppose that you are given the test statistic: t = -1.8. Answer the following questions: We should conduct a Select an answer right-tailed two-tailed left-tailed Correct test. The p-value = __________ (Please show your answer to 3 decimal places.) I just need to help finding the p-value please. Thank youarrow_forwardAssume the random variable X is normally distributed, with mean μ=55 and standard deviation σ=4. Find the 6th percentile.arrow_forward
- A population has a mean = 151 and a standard deviation a=30. Find the mean and standard deviation of the sampling distribution of sample means with sample size n = 42. The mean is μ =, and the standard deviation is o= (Round to three decimal Places as needed.)arrow_forwardThe mean is 146 and the standard deviation is 35. A score of 41 is how many z-scores below the mean?arrow_forwardAssume the random variable X is normally distributed, with mean u= 44 and standard deviationo = 9. Find the 13th percentile.arrow_forward
- Use the given data to find the 95% confidence interval estimate of the population mean μ. Assume that the population has a normal distribution. Give your answers to 2 decimal places. IQ scores of professional athletes: Sample size n 25 Mean x = 104 Standard deviation s = 9 = <μ<arrow_forwardThe distribution of heights in a population of women is approximately normal. Sixteen percent of the women have heights less than 62 inches. About 97.5% of the women have heights less than 71 inches. Use the empirical rule to estimate the mean and standard deviation of the heights in this population. Mean: K inches Standard Deviation: inchesarrow_forwardUse the given data to find the 95% confidence interval estimate of the population mean ?μ. Assume that the population has a normal distribution. IQ scores of professional athletes: Sample size ?=10n=10Mean ?⎯⎯⎯=103x¯=103Standard deviation ?=12s=12 <?<<μ<arrow_forward
arrow_back_ios
SEE MORE QUESTIONS
arrow_forward_ios
Recommended textbooks for you
- MATLAB: An Introduction with ApplicationsStatisticsISBN:9781119256830Author:Amos GilatPublisher:John Wiley & Sons Inc
 Probability and Statistics for Engineering and th...StatisticsISBN:9781305251809Author:Jay L. DevorePublisher:Cengage Learning
 Statistics for The Behavioral Sciences (MindTap C...StatisticsISBN:9781305504912Author:Frederick J Gravetter, Larry B. WallnauPublisher:Cengage Learning
  Elementary Statistics: Picturing the World (7th E...StatisticsISBN:9780134683416Author:Ron Larson, Betsy FarberPublisher:PEARSON
 The Basic Practice of StatisticsStatisticsISBN:9781319042578Author:David S. Moore, William I. Notz, Michael A. FlignerPublisher:W. H. Freeman
 Introduction to the Practice of StatisticsStatisticsISBN:9781319013387Author:David S. Moore, George P. McCabe, Bruce A. CraigPublisher:W. H. Freeman
MATLAB: An Introduction with Applications
Statistics
ISBN:9781119256830
Author:Amos Gilat
Publisher:John Wiley & Sons Inc
Probability and Statistics for Engineering and th...
Statistics
ISBN:9781305251809
Author:Jay L. Devore
Publisher:Cengage Learning
Statistics for The Behavioral Sciences (MindTap C...
Statistics
ISBN:9781305504912
Author:Frederick J Gravetter, Larry B. Wallnau
Publisher:Cengage Learning
Elementary Statistics: Picturing the World (7th E...
Statistics
ISBN:9780134683416
Author:Ron Larson, Betsy Farber
Publisher:PEARSON
The Basic Practice of Statistics
Statistics
ISBN:9781319042578
Author:David S. Moore, William I. Notz, Michael A. Fligner
Publisher:W. H. Freeman
Introduction to the Practice of Statistics
Statistics
ISBN:9781319013387
Author:David S. Moore, George P. McCabe, Bruce A. Craig
Publisher:W. H. Freeman