MATLAB: An Introduction with Applications
6th Edition
ISBN: 9781119256830
Author: Amos Gilat
Publisher: John Wiley & Sons Inc
expand_more
expand_more
format_list_bulleted
Question

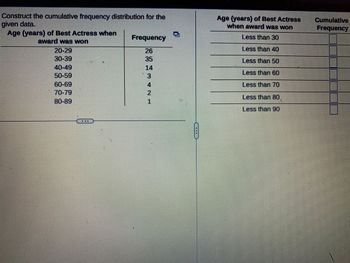
Transcribed Image Text:Construct the cumulative frequency distribution for the
given data.
Age (years) of Best Actress when
award was won
20-29
30-39
40-49
60-69
70-79
80-89
DEE
Frequency
14
25 13
4
PN
1
HRI
IMEMUUMI
Age (years) of Best Actress
when award was won
Less than 30
Less than 40
Less than 50
Less than 60
Less than 70
Less than 80
Less than 90
Cumulative
Frequency
Expert Solution
This question has been solved!
Explore an expertly crafted, step-by-step solution for a thorough understanding of key concepts.
This is a popular solution
Trending nowThis is a popular solution!
Step by stepSolved in 2 steps with 2 images

Knowledge Booster
Similar questions
- On the basis of a population survey, there were 84.4 million males and 98.2 million females 25 years old or older in a certain country. The educational attainment of the males and females is shown in the accompanying table. Complete parts (a) through (d) below.arrow_forwardThe data represent the time, in minutes, spent reading a political blog in a day. Construct a frequency distribution using 5 classes. In the table, include the midpoints, relative frequencies, and cumulative frequencies. Which class has the greatest frequency and which has the least frequency? 15 14 4 7 19 1 16 1 12 17 17 18 14 10 10 Complete the table, starting with the lowest class limit. (Simplify your answers.) Relative Frequency Cumulative Frequency Class Frequency Midpoint Which class has the greatest frequency? The class with the greatest frequency is from to. Which class has the least frequency? The class with the least frequency is from toarrow_forwardUse the cumulative frequency table on the left(top) to fill in the table on the right.(bottom) Classes Cumulative Frequency Under 10 7 Under 20 19 Under 30 38 Under 40 55 Under 50 60 Classes Frequency Relative Frequency 0-9 10-19 20-29 30-39 40-49arrow_forward
- Construct a frequency distribution and a relative frequency histogram for the data set using five classes. Which class has the greatest relative frequency and which has the least relative frequency? Class 11 Ratings from 1 (lowest) to 10 (highest) from 36 taste testers 2 5 9 73 ... 85 54 1 5 56 7 3 3 5 10 9 9 1 6 2 6 2 Construct a frequency distribution for the data using five classes. Frequency 6 4 4 10 9 4 9 6 9 3 1 2arrow_forwardHow many classes are there and what is the class width?arrow_forwardThe data represent the time, in minutes, spent reading a political blog in a day. Construct a frequency distribution using 5 classes. In the table, include the midpoints, relative frequencies, and cumulative frequencies. Which class has the greatest frequency and which has the least frequency? 15 14 4 7 19 12 16 5. 10 17 17 18 14 10 6 Complete the table, starting with the lowest class limit. (Simplify your answers.) Relative Cumulative Class Frequency Midpoint Frequency Frequency Which class has the greatest frequency? The class with the greatest frequency is from to Which class has the least frequency? The class with the least frequency from toarrow_forward
- 3. The data shows the number of students who got scores in Algebra. Given the frequency distribution below, find the mode of the grouped data. Scores in Algebra 75-79 6. 70-74 7. 65-69 2. 60-64 8. 12 55-59 7. 50-54 10 45-49 8. 40-44arrow_forward409 321 227 185 501 550 309 346 472 536 512 116 41 181 305 385 194 496 30 62 381 68 544 387 474 216 356 324 134 Construct a frequency distribution for the given data inclusive of midpoints, relative frequencies and cumulative frequencies.arrow_forward
arrow_back_ios
arrow_forward_ios
Recommended textbooks for you
 MATLAB: An Introduction with ApplicationsStatisticsISBN:9781119256830Author:Amos GilatPublisher:John Wiley & Sons Inc
 Probability and Statistics for Engineering and th...StatisticsISBN:9781305251809Author:Jay L. DevorePublisher:Cengage Learning
 Statistics for The Behavioral Sciences (MindTap C...StatisticsISBN:9781305504912Author:Frederick J Gravetter, Larry B. WallnauPublisher:Cengage Learning
 Elementary Statistics: Picturing the World (7th E...StatisticsISBN:9780134683416Author:Ron Larson, Betsy FarberPublisher:PEARSON
 The Basic Practice of StatisticsStatisticsISBN:9781319042578Author:David S. Moore, William I. Notz, Michael A. FlignerPublisher:W. H. Freeman
 Introduction to the Practice of StatisticsStatisticsISBN:9781319013387Author:David S. Moore, George P. McCabe, Bruce A. CraigPublisher:W. H. Freeman

MATLAB: An Introduction with Applications
Statistics
ISBN:9781119256830
Author:Amos Gilat
Publisher:John Wiley & Sons Inc

Probability and Statistics for Engineering and th...
Statistics
ISBN:9781305251809
Author:Jay L. Devore
Publisher:Cengage Learning

Statistics for The Behavioral Sciences (MindTap C...
Statistics
ISBN:9781305504912
Author:Frederick J Gravetter, Larry B. Wallnau
Publisher:Cengage Learning

Elementary Statistics: Picturing the World (7th E...
Statistics
ISBN:9780134683416
Author:Ron Larson, Betsy Farber
Publisher:PEARSON

The Basic Practice of Statistics
Statistics
ISBN:9781319042578
Author:David S. Moore, William I. Notz, Michael A. Fligner
Publisher:W. H. Freeman

Introduction to the Practice of Statistics
Statistics
ISBN:9781319013387
Author:David S. Moore, George P. McCabe, Bruce A. Craig
Publisher:W. H. Freeman