MATLAB: An Introduction with Applications
6th Edition
ISBN: 9781119256830
Author: Amos Gilat
Publisher: John Wiley & Sons Inc
expand_more
expand_more
format_list_bulleted
Question

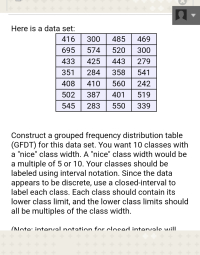
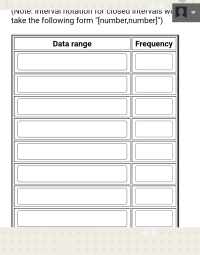
Transcribed Image Text:Construct a grouped frequency distribution table
(GFDT) for this data set. You want 10 classes with
a "nice" class width. A "nice" class width would be
a multiple of 5 or 10. Your classes should be
labeled using interval notation. Since the data
appears to be discrete, use a closed-interval to
label each class. Each class should contain its
lower class limit, and the lower class limits should

Expert Solution
This question has been solved!
Explore an expertly crafted, step-by-step solution for a thorough understanding of key concepts.
This is a popular solution
Trending nowThis is a popular solution!
Step by stepSolved in 2 steps with 5 images

Knowledge Booster
Learn more about
Need a deep-dive on the concept behind this application? Look no further. Learn more about this topic, statistics and related others by exploring similar questions and additional content below.Similar questions
- A data set with whole numbers has a low value of 20 and a high value of 110. Find the class width for a frequency table with seven classes. Find the class limits for a frequency table with seven classes. Lower class limit - Upper class limit First class Second class Third class Fourth class Fifth class Sixth class Seventh classarrow_forwardhow can i tell is a frequency table is skewedarrow_forwardCORStruct a frequency distribution for the g class has the greatest frequency and whicarrow_forward
- Below are the times (in days) it takes for a sample of 22 customers from Jack's computer store to pay their invoices. 19, 15, 43, 39, 35, 31, 27, 22, 18, 14, 42, 38, 13, 13, 41, 41, 37, 37, 37, 33, 33, 33 Send data to calculator Draw the frequency polygon for these data using an initial class boundary of 12.5 and a class width of 7. Note that you can add or remove classes from the figure. Label each class with its midpoint. Frequency 7. Check 26°F Clear Q Search 0:00 00:0 X Save For Later C Submit Assignmearrow_forwardStocks may be categorized by industry. The accompanying data represent three-year rates of return for a sample of financial stocks and retail stocks. Complete parts (a) through (e) below. Click the icon to view the data tables. (a) Construct a relative frequency distribution for each industry. To make an easy comparison, create each frequency distribution so that the lower class limit of the first class is -20 and the class width is Construct a relative frequency distribution for financial stocks. Complete the table below. Rate of Return Relative Frequency Rate of Return Relative Frequency -20 to -0.01 100-119.99 0-19.99 20-39.99 40-59.99 60-79.99 80-99.99 (Round to three decimal places as needed.) -xample Get more help. 120-139.99 140-159.99 160-179.99 180-199.99 1 √₁ Vi 1, Rates of Return Financial Stocks Full data set - 19.75 55.74 55.39 58.44 59.94 0.45 102.29 52.27 195.61 -1.82 44.35 46.14 177.43 85.34 20.57 196.67 57.37 106.80 24.36 93.07 78.51 85.12 176.32 14.83 116.35 150.77…arrow_forwardHere is a data set: Data range 210-229 230-249 250-269 270-289 290-309 214 217 219 223 228 238 241 245 247 253 253 254 X Construct a frequency distribution table for this data set. • Number of classes: 10 • Use a "nice" class width, such as a multiple of 5 or 10. • Label classes using interval notation. • For example, if the class is 70-79, label it as [70,79]. The lower class limit should be a multiple of the class width. • • For example, if the class width is 10, the lower class limit should be a number like 30 or 40 (depending on the data). X 5 263 265 286 291 X 4 50 11 250 X 2 256 X 8 10% Frequency 28 266 269 287 290 291 303 305 307 56 259 262 Xarrow_forward
- How to find the class width of a frequency table?arrow_forwardSuppose a researcher collects data on the air pollution levels, measured in milligrams per cubic meter, for both urban and rural areas in 35 states. The data is plotted with urban air pollution levels on the horizontal axis and rural air pollution levels on the vertical axis. Nevada is an outlier in the ?x‑direction. What must be true about this state? The urban air pollution levels for this state are much higher or lower than the rest of the states in the data set. The rural air pollution levels for this state are much higher or much lower than the rest of the states in the data set. This state is an influential observation. The rural air pollution levels for this state are much higher or lower than other states in the data set that have similar urban air pollution levels. The absolute value of the residual of this state is large.arrow_forwardis a graph showing the number of observations in each class of a frequency distribution. O a histogram O b. polygon O c. frequency distribution O d. relative frequency distributionarrow_forward
arrow_back_ios
arrow_forward_ios
Recommended textbooks for you
 MATLAB: An Introduction with ApplicationsStatisticsISBN:9781119256830Author:Amos GilatPublisher:John Wiley & Sons Inc
 Probability and Statistics for Engineering and th...StatisticsISBN:9781305251809Author:Jay L. DevorePublisher:Cengage Learning
 Statistics for The Behavioral Sciences (MindTap C...StatisticsISBN:9781305504912Author:Frederick J Gravetter, Larry B. WallnauPublisher:Cengage Learning
 Elementary Statistics: Picturing the World (7th E...StatisticsISBN:9780134683416Author:Ron Larson, Betsy FarberPublisher:PEARSON
 The Basic Practice of StatisticsStatisticsISBN:9781319042578Author:David S. Moore, William I. Notz, Michael A. FlignerPublisher:W. H. Freeman
 Introduction to the Practice of StatisticsStatisticsISBN:9781319013387Author:David S. Moore, George P. McCabe, Bruce A. CraigPublisher:W. H. Freeman

MATLAB: An Introduction with Applications
Statistics
ISBN:9781119256830
Author:Amos Gilat
Publisher:John Wiley & Sons Inc

Probability and Statistics for Engineering and th...
Statistics
ISBN:9781305251809
Author:Jay L. Devore
Publisher:Cengage Learning

Statistics for The Behavioral Sciences (MindTap C...
Statistics
ISBN:9781305504912
Author:Frederick J Gravetter, Larry B. Wallnau
Publisher:Cengage Learning

Elementary Statistics: Picturing the World (7th E...
Statistics
ISBN:9780134683416
Author:Ron Larson, Betsy Farber
Publisher:PEARSON

The Basic Practice of Statistics
Statistics
ISBN:9781319042578
Author:David S. Moore, William I. Notz, Michael A. Fligner
Publisher:W. H. Freeman

Introduction to the Practice of Statistics
Statistics
ISBN:9781319013387
Author:David S. Moore, George P. McCabe, Bruce A. Craig
Publisher:W. H. Freeman