
MATLAB: An Introduction with Applications
6th Edition
ISBN: 9781119256830
Author: Amos Gilat
Publisher: John Wiley & Sons Inc
expand_more
expand_more
format_list_bulleted
Related questions
Question
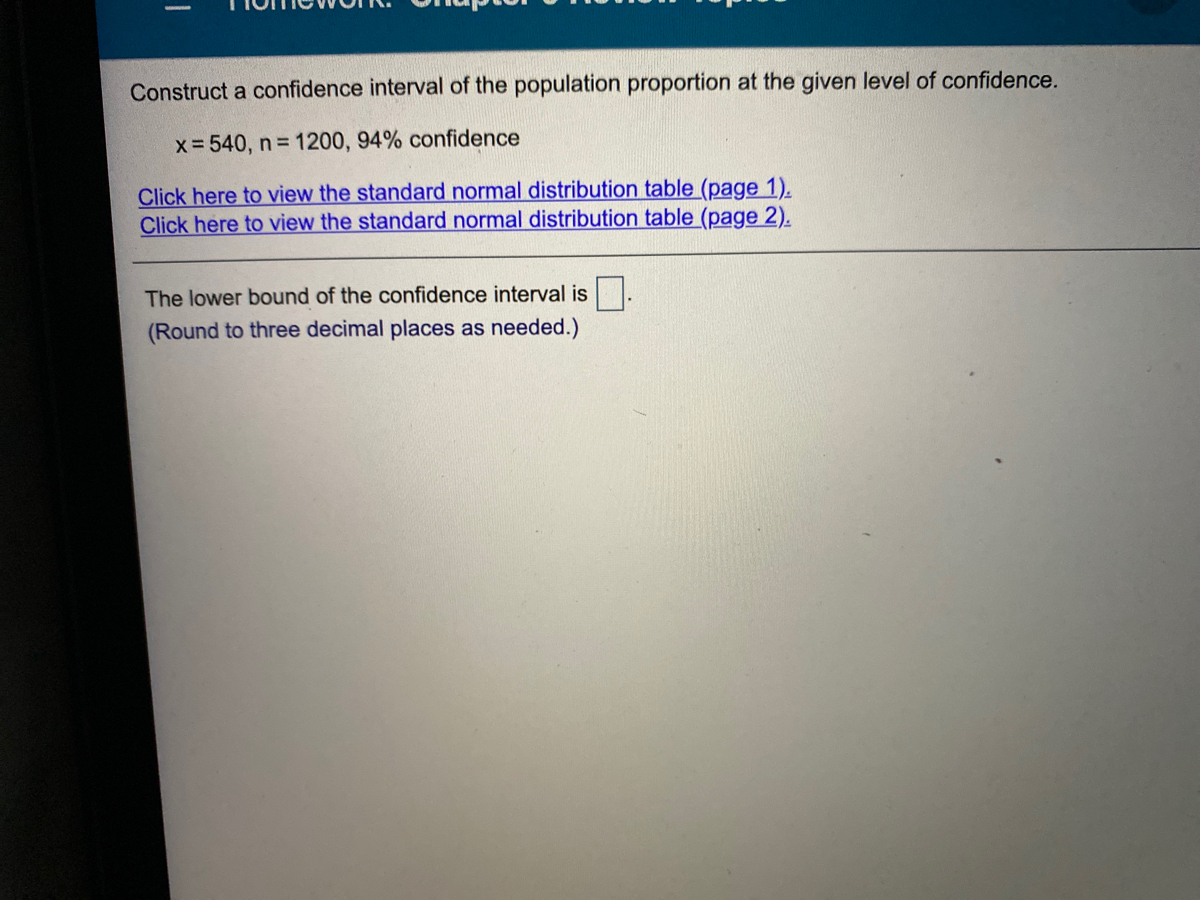

Transcribed Image Text:Construct a confidence interval of the population proportion at the given level of confidence.
x= 540, n 1200, 94% confidence
Click here to view the standard normal distribution table (page 1).
Click here to view the standard normal distribution table (page 2).
The lower bound of the confidence interval is.
(Round to three decimal places as needed.)
Expert Solution
This question has been solved!
Explore an expertly crafted, step-by-step solution for a thorough understanding of key concepts.

This is a popular solution

Trending nowThis is a popular solution!

Step by stepSolved in 2 steps

Knowledge Booster

Similar questions
- Use the normal distribution of IQ scores, which has a mean of 100 and a standard deviation of 18, and the following table with the standard scores and percentiles for a normal distribution to find the indicated quantity. Percentage of scores less than 145 is __% (round to two decimal places as needed)arrow_forwardThe mean is 146 and the standard deviation is 35. A score of 41 is how many z-scores below the mean?arrow_forwardFor the standard normal curve, find the z-score that corresponds to the third quartile. Click here to view page 1 of the standard normal table. Click here to view page 2 of the standard normal table. O A. 0.77 B. - 0.23 O C. -0.67 O D. 0.67arrow_forward
- I'd like the first question answer, the one that fills in the boxes. I can do the restarrow_forwardThe distribution of heights in a population of women is approximately normal. Sixteen percent of the women have heights less than 62 inches. About 97.5% of the women have heights less than 71 inches. Use the empirical rule to estimate the mean and standard deviation of the heights in this population. Mean: K inches Standard Deviation: inchesarrow_forwardUse the normal distribution of IQ scores , which has a mean of 90 and a standard deviation of 14, and the following table with the standard scores and percentiles for a normal distribution to find the indicated quantity. view the table: Standard Scores and Percentiles for a Normal Distribution (cumulative values from the left) Full data set Open in StatCrunch + Copy to Clipboard + Open in Excel + Standard score % Standard score % minus−3.0 0.13 0.1 53.98 minus−2.5 0.62 0.5 69.15 minus−2 2.28 0.9 81.59 minus−1.5 6.68 1 84.13 minus−1 15.87 1.5 93.32 minus−0.9 18.41 2 97.72 minus−0.5 30.85 2.5 99.38 minus−0.1 46.02 3 99.87 0 50.00 3.5 99.98 The percentage of scores between 62 and 118 is ________%. Round to two decimal places as needed.arrow_forward
- Cereals sodium values have a mean of 167 and a standard deviation of 77.3. Find the z-score for the cereal that has a sodium value of 0. How would you interpret this z-score?arrow_forwardThe data in the table is points scored by a basketball team in a certain period of time. Use the data in the table to answer the bulleted statements.arrow_forwardAssume that adults have IQ scores that are normally distributed with a mean of 98.4 and a standard deviation 18.1. Find the first quartile Q₁, which is the IQ score separating the bottom 25% from the top 75%. (Hint: Draw a graph.) The first quartile is (Type an integer or decimal rounded to one decimal place as needed.) wwwarrow_forward
- statistic please answerarrow_forwardz Scores LeBron James, one of the most successful basketball players of all time, has a height of 6 feet 8 inches, or 203 cm. Based on statistics from Data Set 1 “Body Data” in Appendix B, his height converts to the z score of 4.07. How many standard deviations is his height above the mean?arrow_forwardAssume that intelligence follows a normal distribution and that on a standard test for intelligence the true mean (μ) is 100 with a standard deviation (σ) of 15. What test score do you need for your intelligence to be in the top 1% of the population?arrow_forward
arrow_back_ios
SEE MORE QUESTIONS
arrow_forward_ios
Recommended textbooks for you
- MATLAB: An Introduction with ApplicationsStatisticsISBN:9781119256830Author:Amos GilatPublisher:John Wiley & Sons Inc
 Probability and Statistics for Engineering and th...StatisticsISBN:9781305251809Author:Jay L. DevorePublisher:Cengage Learning
 Statistics for The Behavioral Sciences (MindTap C...StatisticsISBN:9781305504912Author:Frederick J Gravetter, Larry B. WallnauPublisher:Cengage Learning
  Elementary Statistics: Picturing the World (7th E...StatisticsISBN:9780134683416Author:Ron Larson, Betsy FarberPublisher:PEARSON
 The Basic Practice of StatisticsStatisticsISBN:9781319042578Author:David S. Moore, William I. Notz, Michael A. FlignerPublisher:W. H. Freeman
 Introduction to the Practice of StatisticsStatisticsISBN:9781319013387Author:David S. Moore, George P. McCabe, Bruce A. CraigPublisher:W. H. Freeman
MATLAB: An Introduction with Applications
Statistics
ISBN:9781119256830
Author:Amos Gilat
Publisher:John Wiley & Sons Inc
Probability and Statistics for Engineering and th...
Statistics
ISBN:9781305251809
Author:Jay L. Devore
Publisher:Cengage Learning
Statistics for The Behavioral Sciences (MindTap C...
Statistics
ISBN:9781305504912
Author:Frederick J Gravetter, Larry B. Wallnau
Publisher:Cengage Learning
Elementary Statistics: Picturing the World (7th E...
Statistics
ISBN:9780134683416
Author:Ron Larson, Betsy Farber
Publisher:PEARSON
The Basic Practice of Statistics
Statistics
ISBN:9781319042578
Author:David S. Moore, William I. Notz, Michael A. Fligner
Publisher:W. H. Freeman
Introduction to the Practice of Statistics
Statistics
ISBN:9781319013387
Author:David S. Moore, George P. McCabe, Bruce A. Craig
Publisher:W. H. Freeman