
MATLAB: An Introduction with Applications
6th Edition
ISBN: 9781119256830
Author: Amos Gilat
Publisher: John Wiley & Sons Inc
expand_more
expand_more
format_list_bulleted
Related questions
Question
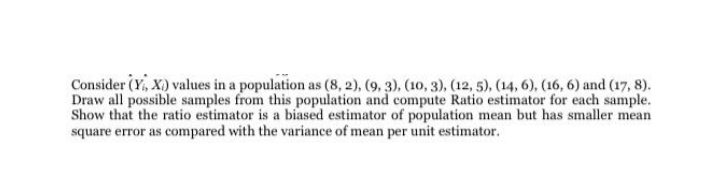

Transcribed Image Text:Consider (Y, X) values in a population as (8, 2), (9, 3), (10, 3), (12, 5), (14, 6), (16, 6) and (17, 8).
Draw all possible samples from this population and compute Ratio estimator for each sample.
Show that the ratio estimator is a biased estimator of population mean but has smaller mean
square error as compared with the variance of mean per unit estimator.
Expert Solution
This question has been solved!
Explore an expertly crafted, step-by-step solution for a thorough understanding of key concepts.

Step by stepSolved in 2 steps with 2 images

Knowledge Booster

Similar questions
- Times for a procedure are normally distributed. There are 2 methods. Method A has a mean of 25 minutes and a standard deviation of 8 minutes. Method B has a mean of 29 minutes and a standard deviation of 4 minutes. Which procedure is preferred if it must be completed within 33 minutes?arrow_forwardA statistics teacher taught a large introductory statistics class, with 500 students having enrolled over many years. The mean score over all those students on the first midterm was u = 88 with standard deviation o = 10. One year, the teacher taught a %3D much smaller class of only 25 students. The teacher wanted to know if teaching a smaller class was more effective and students performed better. We can consider the small class as an SRS of the students who took the large class over the years. The average midterm score was = 78. The hypothesis should be: a. Ho: H = 78 vs. Ha: H = 88. %3D O b. Ho: µ = 88 vs. Ha: µ 78 %3D Ο d. Ho: μ-88 νs. Ha: μ >88. %3Darrow_forwardSay you have two sets of data X1, ..., X10 and Y1,..., Y40. All of this data is considered independent. The first set of data are Normally distributed with mean B and variance 10. The second set of data are Normally distributed with mean y and variance 10. We are trying to estimate 0 = X = X; 18 + y. Consider the estimate ô = }X + Ÿ where 3 4 iX + Y where 10 vi=1 1 10 and Y = E Y;? 40 vi=1 40 (a) What is the mean, variance and distribution of 0? (b) What is the probability that 0 is larger than 1 away from 0? (c) What is the bias, variance and MSE of the estimate 0 for estimating 0?arrow_forward
- The frequency distribution table below is the net weight of a sample of candied fruit products in the food industry cans "ABC": - How many cans have a net weight of less than 20.2 grams. - If we want to compare about the distribution of net weight with the food company "XYZ" for the same type of product. And it is known that the average and variance is 20 grams and 0.04 grams. Which food company has an even distribution of net weight.arrow_forwardOne study claims that the variance in the resting heart rates of smokers is different than the variance in the resting heart rates of nonsmokers. A medical student decides to test this claim. The sample variance of resting heart rates, measured in beats per minute, for a random sample of 9 smokers is 480.7. The sample variance for a random sample of 9 nonsmokers is 131.6. Assume that both population distributions are approximately normal and test the study’s claim using a 0.10 level of significance. Does the evidence support the study’s claim? Let smokers be Population 1 and let nonsmokers be Population 2. Step 1 of 3: State the null and alternative hypotheses for the test. Fill in the blank below. H0: σ21=σ22: Ha: σ21⎯⎯⎯⎯⎯⎯⎯⎯⎯⎯⎯⎯⎯⎯⎯σ22 Step 2 of 3: Compute the value of the test statistic. Round your answer to four decimal places. Step 3 of 3: Draw a conclusion and interpret the decision.arrow_forwardThe life of light bulbs is distributed normaly, The variance of the lifetime is 900 and the mean lifetime of a bulb is 550 hours. Find the probablty of abulb lasting forat least 583 hours. Round your anvwer to four decimal placesarrow_forward
- A professor claims that the final exam grades are more widely dispersed in Principles classes compared to upper-level classes. In a sample of 101 Principles final exams, the standard deviation is 16 while in a sample of 30 upper-level class final exams the standard deviation is 13. Test the hypothesis at the 10% level of significance that the 2 variances are different. Write all formulas and hypothesis.arrow_forwardA dietician is researching two new weight gain supplements that have just hit the market: Ripped and Gainz. She wants to determine if there is any difference between the two supplements in the mean amount of weight gained (in kg) by the people who take them. The dietician tracks the total weight gain (in kg) over a year of a random sample of 14 people taking Ripped and a random sample of 12 people taking Gainz. (These samples are chosen independently.) These data are shown in the table. Total weight gains (in kg) Ripped Gainz 14.1, 10.9, 12.1, 5.2, 12.0, 17.1, 9.0, 14.8, 11.2, 6.8, 12.4, 8.5, 12.1, 10.5 Send data to calc... v 7.6, 9.5, 8.6, 10.8, 7.9, 10.0, 8.4, 6.2, 8.6, 10.2, 8.9, 8.2 Send data to Excel Assume that the two populations of weight gains are approximately normally distributed. Can the dietician conclude, at the 0.05 level of significance, that there is a difference between the population mean of the weights gained by people taking Ripped and the population mean of the…arrow_forward
arrow_back_ios
arrow_forward_ios
Recommended textbooks for you
- MATLAB: An Introduction with ApplicationsStatisticsISBN:9781119256830Author:Amos GilatPublisher:John Wiley & Sons Inc
 Probability and Statistics for Engineering and th...StatisticsISBN:9781305251809Author:Jay L. DevorePublisher:Cengage Learning
 Statistics for The Behavioral Sciences (MindTap C...StatisticsISBN:9781305504912Author:Frederick J Gravetter, Larry B. WallnauPublisher:Cengage Learning
  Elementary Statistics: Picturing the World (7th E...StatisticsISBN:9780134683416Author:Ron Larson, Betsy FarberPublisher:PEARSON
 The Basic Practice of StatisticsStatisticsISBN:9781319042578Author:David S. Moore, William I. Notz, Michael A. FlignerPublisher:W. H. Freeman
 Introduction to the Practice of StatisticsStatisticsISBN:9781319013387Author:David S. Moore, George P. McCabe, Bruce A. CraigPublisher:W. H. Freeman
MATLAB: An Introduction with Applications
Statistics
ISBN:9781119256830
Author:Amos Gilat
Publisher:John Wiley & Sons Inc
Probability and Statistics for Engineering and th...
Statistics
ISBN:9781305251809
Author:Jay L. Devore
Publisher:Cengage Learning
Statistics for The Behavioral Sciences (MindTap C...
Statistics
ISBN:9781305504912
Author:Frederick J Gravetter, Larry B. Wallnau
Publisher:Cengage Learning
Elementary Statistics: Picturing the World (7th E...
Statistics
ISBN:9780134683416
Author:Ron Larson, Betsy Farber
Publisher:PEARSON
The Basic Practice of Statistics
Statistics
ISBN:9781319042578
Author:David S. Moore, William I. Notz, Michael A. Fligner
Publisher:W. H. Freeman
Introduction to the Practice of Statistics
Statistics
ISBN:9781319013387
Author:David S. Moore, George P. McCabe, Bruce A. Craig
Publisher:W. H. Freeman