MATLAB: An Introduction with Applications
6th Edition
ISBN: 9781119256830
Author: Amos Gilat
Publisher: John Wiley & Sons Inc
expand_more
expand_more
format_list_bulleted
Question
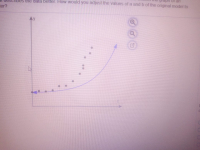
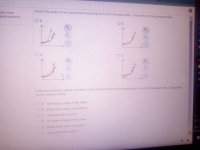
Consider the scattergram of data and the graph of the model f(t)=abt in the figure below. Sketch the graph of an exponential model that describes the data better. How would you adjust the values of a and b of the original model to describe the data better?


Expert Solution
This question has been solved!
Explore an expertly crafted, step-by-step solution for a thorough understanding of key concepts.
This is a popular solution
Trending nowThis is a popular solution!
Step by stepSolved in 2 steps

Knowledge Booster
Learn more about
Need a deep-dive on the concept behind this application? Look no further. Learn more about this topic, statistics and related others by exploring similar questions and additional content below.Similar questions
- Data contains brain mass in different species versus glia-neuron ratio, the latter being a measurement of brain metabolism as the glia provides the metabolic needs of the neurons. The relationship between THE LOGARITHM of the brain mass (in the third column) and Glia-neuron ratio (fourth column) appears linear and it is these two variables that we wish to analyze via linear regression. We would like to know if the human brain fits the trend from the other species. Towards this end we will perform the regression on all species EXCEPT humans (Homo sapiens). Again, throw out the human data from your analysis. You will however need the human numbers for some of the questions. What is the coefficient of determination (R2) for the data? What is the standard error of the slope of the regression line (SEb) ?arrow_forwardTable 3 gives the market value of a luxury sedan (in dollars) xyears after its purchase. Find an exponential regression model of the form y= ab* for this data set. Estimate the purchase price of the sedan. Estimate the value of the sedan 10 years after its purchase. Round answers to the nearest dollar. TABLE 3 Value ($) 1 23,125 19,050 3 15,625 11,875 5 9,450 6 7,125 2.arrow_forwardSmith is studying the relationship between length (X) and weight (Y) of infants. Please help him fit an exponential growth model to find the relationship between length and weight. Write down the model and explain how to fit the model (i.e., how to estimate regression coefficients) and what the intercept is for the relationship between X and Y (in symbolic form).arrow_forward
- Recently there has been a rise in fatal accidents caused by “distracted driving.” The United States National Highway Traffic Safety Administration (NHSTA) defines a distraction as anything that diverts attention from driving. The following model estimates the trend in distracted driving accidents over time based on data from the NHSTA:D = 0.015t - 29.97 In this model, D is the decimal to be turned into a percentage of all fatal accidents caused by distracted driving, and t is any calendar year between 2000 and 2020. Use the model to estimate the rate for 2005 and 2020. Note: this means to plug n 2005 for t and simplify and then turn your answer into a percent. Then plug in 2020 for t and simplify and then turn your answer into a percent.arrow_forwardDetermine the value of a and barrow_forwardJane collects data from 40 elementary school students and finds that the relationship between age (x) and score on a certain test (y) is given by y=3.2x+45. What can she extrapolate about the score a 16-year old will get on the test?arrow_forward
- The following equation describes the relationship between output and labor input at a sample of work stations in a manufacturing plant ŷ = 2.35+2.20X. Suppose, for a selected workstation, the labor input is 5, the predicted output is?arrow_forward. Fill in the "Years since 1970" column for the data to the right. Make a scatter plot in Excel of the data using Years since 1970 and Total Waste in Millions of Tons (Title your graph and label your axes appropriately). How would you best describe the trend? Add an exponential regression model to the data. Write the equation below. Is it a good fit? Explain how you know. Based on the exponential model, what is the growth rate per year? Explain the meaning of the growth rate in the context of the data. Using the exponential model, make a prediction of how much plastic will be in landfills (and the ocean gyres) by Year Years since 1970 Total Waste in Millions of Tons 1970 0 249 1980 10 798 1985 15 1200 1990 20 1740 1995 25 2440 2000 30 3390 2005 35 4600 2010 40 6060 2015 45 7820 Do you think recycling alone will solve this problem (See Q11 and Q12)? What are some of the challenges in recycling plastic that might hinder the world from recycling all plastic…arrow_forward
arrow_back_ios
arrow_forward_ios
Recommended textbooks for you
 MATLAB: An Introduction with ApplicationsStatisticsISBN:9781119256830Author:Amos GilatPublisher:John Wiley & Sons Inc
 Probability and Statistics for Engineering and th...StatisticsISBN:9781305251809Author:Jay L. DevorePublisher:Cengage Learning
 Statistics for The Behavioral Sciences (MindTap C...StatisticsISBN:9781305504912Author:Frederick J Gravetter, Larry B. WallnauPublisher:Cengage Learning
 Elementary Statistics: Picturing the World (7th E...StatisticsISBN:9780134683416Author:Ron Larson, Betsy FarberPublisher:PEARSON
 The Basic Practice of StatisticsStatisticsISBN:9781319042578Author:David S. Moore, William I. Notz, Michael A. FlignerPublisher:W. H. Freeman
 Introduction to the Practice of StatisticsStatisticsISBN:9781319013387Author:David S. Moore, George P. McCabe, Bruce A. CraigPublisher:W. H. Freeman

MATLAB: An Introduction with Applications
Statistics
ISBN:9781119256830
Author:Amos Gilat
Publisher:John Wiley & Sons Inc

Probability and Statistics for Engineering and th...
Statistics
ISBN:9781305251809
Author:Jay L. Devore
Publisher:Cengage Learning

Statistics for The Behavioral Sciences (MindTap C...
Statistics
ISBN:9781305504912
Author:Frederick J Gravetter, Larry B. Wallnau
Publisher:Cengage Learning

Elementary Statistics: Picturing the World (7th E...
Statistics
ISBN:9780134683416
Author:Ron Larson, Betsy Farber
Publisher:PEARSON

The Basic Practice of Statistics
Statistics
ISBN:9781319042578
Author:David S. Moore, William I. Notz, Michael A. Fligner
Publisher:W. H. Freeman

Introduction to the Practice of Statistics
Statistics
ISBN:9781319013387
Author:David S. Moore, George P. McCabe, Bruce A. Craig
Publisher:W. H. Freeman