Advanced Engineering Mathematics
10th Edition
ISBN: 9780470458365
Author: Erwin Kreyszig
Publisher: Wiley, John & Sons, Incorporated
expand_more
expand_more
format_list_bulleted
Question

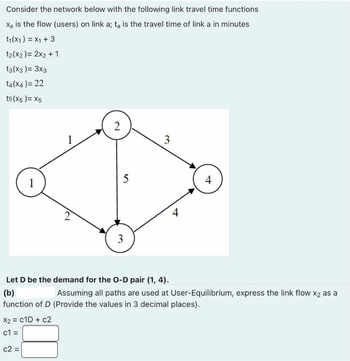
Transcribed Image Text:Consider the network below with the following link travel time functions
X₂ is the flow (users) on link a; ta is the travel time of link a in minutes
t₁(x1) = x1 + 3
t₂(x2) = 2x2 + 1
t3(x3) = 3x3
t4(x4) = 22
t5(x5)= X5
2
c2 =
5
3
3
4
Let D be the demand for the O-D pair (1, 4).
(b)
Assuming all paths are used at User-Equilibrium, express the link flow X2 as a
function of D (Provide the values in 3 decimal places).
X2 = C1D + c2
c1=
Expert Solution
This question has been solved!
Explore an expertly crafted, step-by-step solution for a thorough understanding of key concepts.
Step by stepSolved in 3 steps

Knowledge Booster
Similar questions
- Suppose a furniture builder has two models of a bookcase: standard and artisan. The standard model requires 5 hours to assemble and 1 hours for finishing touches. The artisan model requires 2 hours to assemble and 4 hours for finishing touches. Based on their current staffing, they can manage a maximum number of assembly hours available is 50 per day, and the maximum number of finishing hours available is 64 per day. Let x = the number of standard model bookcases produced per day and y = the number of artisan model bookcases produced per day. Write the system of inequalities that represents the maximum number of bookcases that can be produced in one day. 0 Graph the system of inequalities, remember to include x >0 and y > 0 in your graph to get full credit. You will need to include four lines. 25 24 VIarrow_forwardA collector of antique clocks sold at auction believes that the price received for the clocks may be modeled as a linear function of the age of the clocks and the number of bidders at the auction. After a preliminary study and collection of 32 observations, the collector came up with the following second-order model: y = BO+B₁x₁+B₂x₂ + ß3 x1x2 +B4x² +ɛ, where y: price of a clock; x₁: age of a clock; x2: the number of bidders. Considering the output below and by setting a = 0.05, answer the following questions. The regression equation is Price = 262 +2.26 Age + 14.2 Bidder + 1.13 AgeBid 4.20 Bid^2 Predictor Constant -261.7 2.260 14.21 Age Bidder AgeBid Bid^2 S = 84.512 Coef SE Coef 1.1301 -4.196 Analysis of Variance Source 404.4 2.052 R-Sq= 96.0% Variable Age Bidder AgeBid Bid^2 60.83 0.23 5.17 0.000 0.219 1.344 -3.12 0.004 R-Sq (adj) DF Regression 4 4606950 Residual Error 27 192840 Total 31 4799790 SS T P -0.65 0.523 1.10 0.280 0.817 a. Is the model useful as a whole? Apply an…arrow_forwardExplain what is meant when two variables are positively linesrly related. What would scatter plott look like? Two variables x and y are postively linearly related if when the x value increases , the y value increases or decrease? The points on a scatter plot fall approximately in a-an ascending straight line b- a descending curve c- a descending straight line or d- an ascending curve from left to right?arrow_forward
arrow_back_ios
arrow_forward_ios
Recommended textbooks for you
 Advanced Engineering MathematicsAdvanced MathISBN:9780470458365Author:Erwin KreyszigPublisher:Wiley, John & Sons, Incorporated
 Numerical Methods for EngineersAdvanced MathISBN:9780073397924Author:Steven C. Chapra Dr., Raymond P. CanalePublisher:McGraw-Hill Education
 Introductory Mathematics for Engineering Applicat...Advanced MathISBN:9781118141809Author:Nathan KlingbeilPublisher:WILEY
 Mathematics For Machine TechnologyAdvanced MathISBN:9781337798310Author:Peterson, John.Publisher:Cengage Learning,


Advanced Engineering Mathematics
Advanced Math
ISBN:9780470458365
Author:Erwin Kreyszig
Publisher:Wiley, John & Sons, Incorporated

Numerical Methods for Engineers
Advanced Math
ISBN:9780073397924
Author:Steven C. Chapra Dr., Raymond P. Canale
Publisher:McGraw-Hill Education

Introductory Mathematics for Engineering Applicat...
Advanced Math
ISBN:9781118141809
Author:Nathan Klingbeil
Publisher:WILEY

Mathematics For Machine Technology
Advanced Math
ISBN:9781337798310
Author:Peterson, John.
Publisher:Cengage Learning,

