
MATLAB: An Introduction with Applications
6th Edition
ISBN: 9781119256830
Author: Amos Gilat
Publisher: John Wiley & Sons Inc
expand_more
expand_more
format_list_bulleted
Related questions
Question
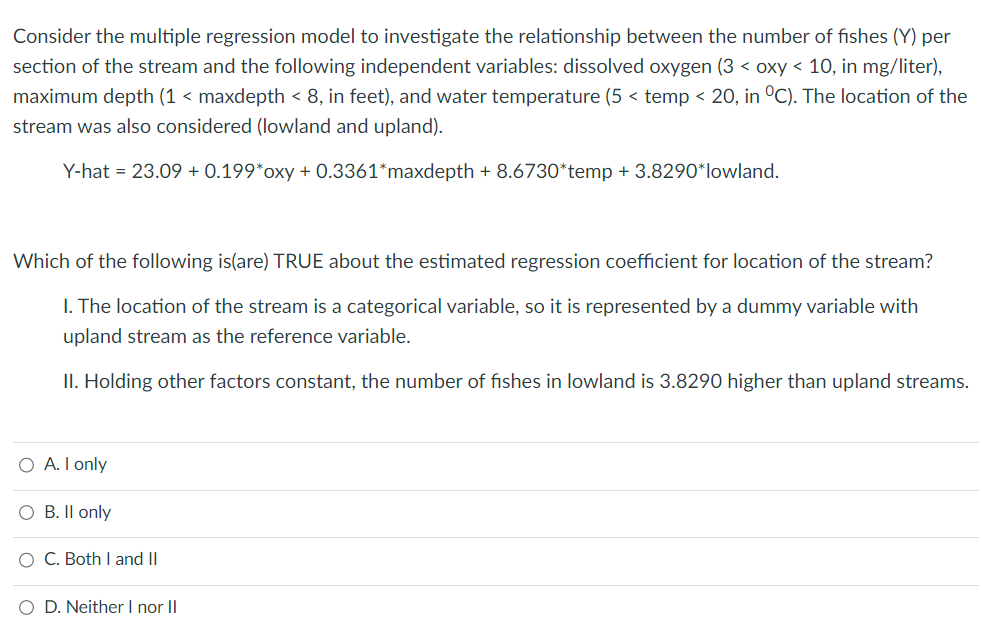

Transcribed Image Text:Consider the multiple regression model to investigate the relationship between the number of fishes (Y) per
section of the stream and the following independent variables: dissolved oxygen (3 < oxy < 10, in mg/liter),
maximum depth (1 < maxdepth < 8, in feet), and water temperature (5< temp < 20, in °C). The location of the
stream was also considered (lowland and upland).
Y-hat = 23.09 + 0.199*oxy + 0.3361*maxdepth +8.6730*temp + 3.8290* lowland.
Which of the following is(are) TRUE about the estimated regression coefficient for location of the stream?
1. The location of the stream is a categorical variable, so it is represented by a dummy variable with
upland stream as the reference variable.
II. Holding other factors constant, the number of fishes in lowland is 3.8290 higher than upland streams.
O A. I only
O B. II only
O C. Both I and II
O D. Neither I nor II
Expert Solution
This question has been solved!
Explore an expertly crafted, step-by-step solution for a thorough understanding of key concepts.

Step by stepSolved in 2 steps

Knowledge Booster

Similar questions
- A researcher is interested in finding out the factors which determined the yearly spending on family outings last year (Y, measured in dollars). She compiles data on the number of members in a family (X,), the annual income of the family (X,), and the number of times the family went out on an outing in the last year (X). She collects data from 152 families and estimates the following regression: Y = 120.45 + 1.12X, + 2.12X2 + 1.98X3 Suppose B1. B2, B3, denote the population slope coefficients of X, X2, and X3, respectively The researcher wants to check if neither X, nor X, have a significant effect on Y or at least one of them has a significant effect, keeping X3 constant. She calculates the value of the F-statistic for the test with the two restrictions (Ho: B, = 0, B2 = 0 vs. H B, 0 and/or Bz 0) to be 3.00. The p-value for the test will be (Round your answer to two decimal places.) At the 10% significance level, we will the null hypothesis. reject fail to reject Enter your answer in…arrow_forwardPlease do the first three partsarrow_forwardThe volume (in cubic feet) of a black cherry tree can be modeled by the equation y = - 50.7 + 0.3x, + 5.2x2, where x, is the tree's height (in feet) and x2 is the tree's diameter (in inches). Use the multiple regression equation to predict the y-values for the values of the independent variables. X1 = 70, x, = 8.9 The predicted volume is cubic feet. (Round to one decimal place as needed.)arrow_forward
- A researcher believes that there is a linear association between the level of potassiumcontent (y) in milligrams and the amount of fiber (x) in grams in cereal. The regression line forthe data is computed to be: ŷ = 36+27x rate. It was also computed that r = .62 b. If a cereal has 4 grams of fiber and a potassium content of 160 milligrams, what is thevalue of the residual?arrow_forwardWrinkle recovery angle and tensile strength are the two most important characteristics for evaluating the performance of crosslinked cotton fabric. An increase in the degree of crosslinking, as determined by ester carboxyl band absorbance, improves the wrinkle resistance of the fabric (at the expense of reducing mechanical strength). The accompanying data on x = absorbance and y = wrinkle resistance angle was read from a graph in the paper "Predicting the Performance of Durable Press Finished Cotton Fabric with Infrared Spectroscopy".t x 0.115 0.126 0.183 0.246 0.282 0.344 0.355 0.452 0.491 0.554 0.651 y 334 342 355 363 365 372 381 400 392 412 420 Here is regression output from Minitab: Predictor Constant absorb S = 3.60498 Coef 321.878 156.711 SOURCE Regression Residual Error Total R-Sq= 98.5% DF SE Coef 2.483 6.464 1 9 10 SS 7639.0 117.0 7756..0 T 129.64 24.24 P 0.000 0.000. R-Sq (adj) 98.3% MS 7639.0 13.0 F 587.81 (a) Does the simple linear regression model appear to be appropriate?…arrow_forwardUsing the following table, I'm not sure how to answer these questions: a) Find the estimated regression equation of price on the percentage of space containing ads. y^ = +( )x b) Predict the price of a magazine with 47% of is space containing ads. rounding to 3 decimal places c) Estimate the price of a magazine with 98% of its space containing ads. Runded to 3 decimal placesarrow_forward
- A particular article presented data on y = tar content (grains/100 ft³) of a gas stream as a function of x₁ = rotor speed (rev/min) and x₂ = gas inlet temperature (°F). The following regression model using X₁, X2, X3 = ×₂² and ×4 = X₁X₂ was suggested. (mean y value) = 86.5 – 0.121x₁ +5.07x2 - 0.0706x3 + 0.001x4 (a) According to this model, what is the mean y value (in grains/100 ft³) if x₁ = 3,400 and x₂ = 55. grains/100 ft³ (b) For this particular model, does it make sense to interpret the value of ₂ as the average change in tar content associated with a 1-degree increase in gas inlet temperature when rotor speed is held constant? Explain. Yes, since there are no other terms involving X2. O Yes, since there are other terms involving X₂. ● No, since there are other terms involving X2. O No, since there are no other terms involving X2.arrow_forwardA chemical process was studied using a 2k design. Using ANOVA, the results have been modeled to produce the following linear equation in coded units: Vield =28.360+0.615 Temperature +0.485 Time Along the direction of steepest ascent. how many coded units must be moved in the Time direction for each step of one coded unit in the Temperature direction? Express your answer to 3 decimal places (XXXXX) Your Answer:arrow_forwardThe owner of a movie theater company used multiple regression analysis to predict gross revenue (y) as a function of television advertising (x,) and newspaper advertising (x,). The estimated regression equation was ý = 83.3 + 2.24x, + 1.30x2. The computer solution, based on a sample of eight weeks, provided SST 25.2 and SSR = 23.455. %D (a) Compute and interpret R² and R,. (Round your answers to three decimal places.) The proportion of the variability in the dependent variable that can be explained by the estimated multiple regression equation is . Adjusting for the number of independent variables in the model, the proportion of the variability in the dependent variable that can be explained by the estimated multiple regression equation is (b) When television advertising was the only independent variable, R = 0.653 and R, = 0.595. Do you prefer the multiple regression results? Explain. %3D 2 Multiple regression analysi v ---Select--- ipreferred since both R2 and R, show ---Select--- O…arrow_forward
- The line of best fit through a set of data is ý = 38.241 – 1.827r According to this equation, what is the predicted value of the dependent variable when the independent variable has value 20? y = Round to 1 decimal place.arrow_forwardWrinkle recovery angle and tensile strength are the two most important characteristics for evaluating the performance of crosslinked cotton fabric. An increase in the degree of crosslinking, as determined by ester carboxyl band absorbance, improves the wrinkle resistance of the fabric (at the expense of reducing mechanical strength). The accompanying data on x = absorbance and y = wrinkle resistance angle was read from a graph in the paper "Predicting the Performance of Durable Press Finished Cotton Fabric with Infrared Spectroscopy".† x 0.115 0.126 0.183 0.246 0.282 0.344 0.355 0.452 0.491 0.554 0.651 y 334 342 355 363 365 372 381 392 400 412 420 Here is regression output from Minitab: Predictor Constant absorb S = 3.60498 Coef 321.878 156.711 SOURCE Regression Residual Error Total SE Coef 2.483 6.464 R-Sq = 98.5% DF 1 9 10 SS 7639.0 117.0 7756.0 T 129.64 24.24 0.000 0.000 R-Sq (adj) = 98.3% MS 7639.0 13.0 F P 587.81 (a) Does the simple linear regression model appear to be…arrow_forwardConsider a linear regression model for the decrease in blood pressure (mmHg) over a four-week period with muy=2.8+0.8x and standard deviation chi=3.2. The explanatory variable x is the number of servings fruits and vegetables in a calorie-controlled diet. Explain clearly what this slope says about the change in the mean of y for a change in x.arrow_forward
arrow_back_ios
SEE MORE QUESTIONS
arrow_forward_ios
Recommended textbooks for you
- MATLAB: An Introduction with ApplicationsStatisticsISBN:9781119256830Author:Amos GilatPublisher:John Wiley & Sons Inc
 Probability and Statistics for Engineering and th...StatisticsISBN:9781305251809Author:Jay L. DevorePublisher:Cengage Learning
 Statistics for The Behavioral Sciences (MindTap C...StatisticsISBN:9781305504912Author:Frederick J Gravetter, Larry B. WallnauPublisher:Cengage Learning
  Elementary Statistics: Picturing the World (7th E...StatisticsISBN:9780134683416Author:Ron Larson, Betsy FarberPublisher:PEARSON
 The Basic Practice of StatisticsStatisticsISBN:9781319042578Author:David S. Moore, William I. Notz, Michael A. FlignerPublisher:W. H. Freeman
 Introduction to the Practice of StatisticsStatisticsISBN:9781319013387Author:David S. Moore, George P. McCabe, Bruce A. CraigPublisher:W. H. Freeman
MATLAB: An Introduction with Applications
Statistics
ISBN:9781119256830
Author:Amos Gilat
Publisher:John Wiley & Sons Inc
Probability and Statistics for Engineering and th...
Statistics
ISBN:9781305251809
Author:Jay L. Devore
Publisher:Cengage Learning
Statistics for The Behavioral Sciences (MindTap C...
Statistics
ISBN:9781305504912
Author:Frederick J Gravetter, Larry B. Wallnau
Publisher:Cengage Learning
Elementary Statistics: Picturing the World (7th E...
Statistics
ISBN:9780134683416
Author:Ron Larson, Betsy Farber
Publisher:PEARSON
The Basic Practice of Statistics
Statistics
ISBN:9781319042578
Author:David S. Moore, William I. Notz, Michael A. Fligner
Publisher:W. H. Freeman
Introduction to the Practice of Statistics
Statistics
ISBN:9781319013387
Author:David S. Moore, George P. McCabe, Bruce A. Craig
Publisher:W. H. Freeman