MATLAB: An Introduction with Applications
6th Edition
ISBN: 9781119256830
Author: Amos Gilat
Publisher: John Wiley & Sons Inc
expand_more
expand_more
format_list_bulleted
Question
Consider the market for pens. Suppose that a new educational study has proven that the practice of writing, erasing, and rewriting improves students' ability to process information, leading parents to steer away from pen use in favor of pencils. Moreover, the price of ink, an important input in pen production, has increased considerably.
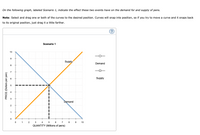
On the following graph, labeled Scenario 1, indicate the effect these two events have on the demand for and supply of pens.
Note: Select and drag one or both of the curves to the desired position. Curves will snap into position, so if you try to move a curve and it snaps back to its original position, just drag it a little farther.
(I have attached the pictures of the graph that came with this question)

Transcribed Image Text:On the following graph, labeled Scenario 1, indicate the effect these two events have on the demand for and supply of pens.
Note: Select and drag one or both of the curves to the desired position. Curves will snap into position, so if you try to move a curve and it snaps back
to its original position, just drag it a little farther.
(?
Scenario 1
10
Supply
Demand
8
6
Supply
3
Demand
3 4 5
QUANTITY (Millions of pens)
0 1
2
6
7
8
10
PRICE (Dollars per pen)

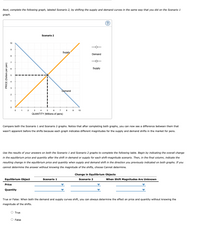
Transcribed Image Text:Next, complete the following graph, labeled Scenario 2, by shifting the supply and demand curves in the same way that you did on the Scenario 1
graph.
Scenario 2
10
Supply
Demand
8
7
6
Supply
5
Demand
1
3
4
6
7
8
9
10
QUANTITY (Millions of pens)
Compare both the Scenario 1 and Scenario 2 graphs. Notice that after completing both graphs, you can now see a difference between them that
wasn't apparent before the shifts because each graph indicates different magnitudes for the supply and demand shifts in the market for pens.
Use the results of your answers on both the Scenario 1 and Scenario 2 graphs to complete the following table. Begin by indicating the overall change
in the equilibrium price and quantity after the shift in demand or supply for each shift-magnitude scenario. Then, in the final column, indicate the
resulting change in the equilibrium price and quantity when supply and demand shift in the direction you previously indicated on both graphs. If you
cannot determine the answer without knowing the magnitude of the shifts, choose Cannot determine.
Change in Equilibrium Objects
Equilibrium Object
Scenario 1
Scenario 2
When Shift Magnitudes Are Unknown
Price
Quantity
True or False: When both the demand and supply curves shift, you can always determine the effect on price and quantity without knowing the
magnitude of the shifts.
O True
O False
PRICE (Dollars per pen)
Expert Solution
This question has been solved!
Explore an expertly crafted, step-by-step solution for a thorough understanding of key concepts.
This is a popular solution
Trending nowThis is a popular solution!
Step by stepSolved in 5 steps with 3 images

Knowledge Booster
Similar questions
- Case. 15.1. Ski Jacket Production. Egress, Inc., is a small company that designs, produces, and sells ski jackets and other coats. The creative design team has labored for weeks over its new design for the coming winter season. It is now time to decide how many ski jackets to produce in this production run. Because of the lead times involved, no other production runs will be possible during the season. Predicting ski jacket sales months in advance of the selling season can be quite tricky. Egress has been in operation for only three years, and its ski jacket designs were quite successful in two of those years. Based on realized sales from the last three years, current economic conditions, and professional judgment, 12 Egress employees have independently estimated demand for their new design for the upcoming season. Their estimates are listed in Table 15.2 To assist in the decision on the number of units for the production run, management has gathered the data in Table 15.3. Note that S…arrow_forward.A new, miracle diabetes drug that diminishes major symptoms of diabetes has been approved by the FDA. Health care professionals and researchers believe that the new drug will prolong lifespan of diabetes patients. If the population is in steady state and the incidence is constant, what will the effect of this new drug be on the prevalence of diabetes in the population? Explain.arrow_forwardA 1 Program Per-Year Tuition ($) 62486 68484 67888 HN34567000 2 8 9 10 11 12 13 14 15 16 17 18 19 20 21 22 23 24 25 26 27 28 29 30 31 32 33 34 35 36 37 38 39 40 67050 67792 66183 66648 69860 64013 63704 66855 62839 60049 57895 55895 53947 54645 53374 52975 49195 44629 47459 48355 47415 38386 48726 48050 51251 37376 32404 44246 40984 49238 33366 23635 41729 38862 B Mean Starting Salary Upon Graduation ($) 155737 154423 149313 143503 140925 153696 147799 149794 134756 147521 142518 143619 141792 138082 125249 114639 127846 127392 130064 123958 115916 111221 110846 106083 79315 79529 103321 74754 86946 72656 76078 53979 63709 102611 53719 81335 51657 U D E F Garrow_forward
- Read the journal excerpt below:Exposure to light at night suppresses the physiologic production of melatonin, a hormone that has antiproliferative effects on intestinal cancers. Although observational studies have associated night-shift work with an increased risk of breast cancer, the effect of night-shift work on the risk of other cancers is not known. We examined the relationship between working rotating night shifts and the risk of colorectal cancers among female participants in the Nurses’ Health Study. We documented 602 incident cases of colorectal cancer among 78 586 women who were followed up from 1988 through 1998. Compared with women who never worked rotating night shifts, women who worked 15 years or more on rotating night shifts were 1.35 times more likely to develop colorectal cancer (95% CI = 1.03 to 1.77), adjusting for confounders. These data suggest that working a rotating night shift at least three nights per month for 15 or more years may increase the risk of…arrow_forwardIn an article in the Journal of Marketing, Bayus studied the differences between "early replacement buyers" and "late replacement buyers" in making consumer durable good replacement purchases. Early replacement buyers are consumers who replace a product during the early part of its lifetime, while late replacement buyers make replacement purchases late in the product's lifetime. In particular, Bayus studied automobile replacement purchases. Consumers who traded in cars with ages of zero to three years and mileages of no more than 35,000 miles were classified as early replacement buyers. Consumers who traded in cars with ages of seven or more years and mileages of more than 73,000 miles were classified as late replacement buyers. Bayus compared the two groups of buyers with respect to demographic variables such as income, education, age, and so forth. He also compared the two groups with respect to the amount of search activity in the replacement purchase process. Variables compared…arrow_forward3. Scenario It is believed that large doses of acetaminophen (the active ingredient in over the counter pain relievers like Tylenol) may cause damage to the liver in nearly half of those tested. A researcher wants to conduct a study to estimate if the proportion of acetaminophen users who have liver damage is the same as previously reported. For participating in this study, he will pay each subject $20 and provide a free medical consultation if the patient has liver damage. Part A If he wants to limit the margin of error of his 98% confidence interval to 2%, what is the minimum number of subjects he needs? (answer should be in the form of x,xxx) the minimum amount of money he needs to set aside to pay his subjects? $ (answer should be in the form of $xx,xxx) Part B The amount you calculated in Part A is substantially over his budget so he decides to use fewer subjects. Will this change increase or decrease the width of his confidence interval? Will this new confidence interval be…arrow_forward
- or each predictor variable, state the P-value and determine whether the predictor variable is significant in explaining delivery charges. Predictor variables P-value Significant in explain Delivery charges Distance .................. .............. Weight .................. .............. Boxes ............... .................arrow_forwardOverhead Door (OD) Corporation’s founder, C. G. Johnson, invented the upward-lifting garage door in 1921 and the electric garage door opener in 1926. Since then OD has been a leading supplier of commercial, industrial, and residential garage doors sold through a nationwide network of more than 450 authorized distributors. They have built a solid reputation as a premier door supplier, commanding 15 % share of the market. Suppose that customers assess door quality first in terms of the ease of operation, followed by its durability. The quality improvement team (QIT) might then assign an engineering team to determine the factors that contribute to these two main problems. Smooth operation of a garage door is a critical quality characteristic that affects both problems: If a door is too heavy, it’s difficult and unsafe to balance and operate; if it’s too light, it tends to buckle and break down frequently or may not close properly. Suppose the design engineers determine that a standard…arrow_forwardA gerontologist investigating various aspects of aging process wanted to see whether staying “ lean and mean, “ that is, being under normal body inbred line to one of three diets: (1) unlimited access to food, (2) 90% of the amount of food that a rat of size would normally eat, or (3) 80% of amount of food that a rat of the size would normally eat. She maintained the rats on three diets throughout their lives and recorded their lifespans (in years). Five rates in each group. Is there evidence that diet affected life span in this study? Let α= 0.01 Complete the ANOVA table . Source of variation df SS MS Fc Treatment 2 1.575 Error 12 Total 14 5.60 A) Hypothesis Test H0: H1: B) Test Statistic C) Decision Rule d) Conclusion *(please with equations and explanation) and thamnk youarrow_forward
arrow_back_ios
arrow_forward_ios
Recommended textbooks for you
 MATLAB: An Introduction with ApplicationsStatisticsISBN:9781119256830Author:Amos GilatPublisher:John Wiley & Sons Inc
 Probability and Statistics for Engineering and th...StatisticsISBN:9781305251809Author:Jay L. DevorePublisher:Cengage Learning
 Statistics for The Behavioral Sciences (MindTap C...StatisticsISBN:9781305504912Author:Frederick J Gravetter, Larry B. WallnauPublisher:Cengage Learning
 Elementary Statistics: Picturing the World (7th E...StatisticsISBN:9780134683416Author:Ron Larson, Betsy FarberPublisher:PEARSON
 The Basic Practice of StatisticsStatisticsISBN:9781319042578Author:David S. Moore, William I. Notz, Michael A. FlignerPublisher:W. H. Freeman
 Introduction to the Practice of StatisticsStatisticsISBN:9781319013387Author:David S. Moore, George P. McCabe, Bruce A. CraigPublisher:W. H. Freeman

MATLAB: An Introduction with Applications
Statistics
ISBN:9781119256830
Author:Amos Gilat
Publisher:John Wiley & Sons Inc

Probability and Statistics for Engineering and th...
Statistics
ISBN:9781305251809
Author:Jay L. Devore
Publisher:Cengage Learning

Statistics for The Behavioral Sciences (MindTap C...
Statistics
ISBN:9781305504912
Author:Frederick J Gravetter, Larry B. Wallnau
Publisher:Cengage Learning

Elementary Statistics: Picturing the World (7th E...
Statistics
ISBN:9780134683416
Author:Ron Larson, Betsy Farber
Publisher:PEARSON

The Basic Practice of Statistics
Statistics
ISBN:9781319042578
Author:David S. Moore, William I. Notz, Michael A. Fligner
Publisher:W. H. Freeman

Introduction to the Practice of Statistics
Statistics
ISBN:9781319013387
Author:David S. Moore, George P. McCabe, Bruce A. Craig
Publisher:W. H. Freeman