
MATLAB: An Introduction with Applications
6th Edition
ISBN: 9781119256830
Author: Amos Gilat
Publisher: John Wiley & Sons Inc
expand_more
expand_more
format_list_bulleted
Related questions
Concept explainers
Question
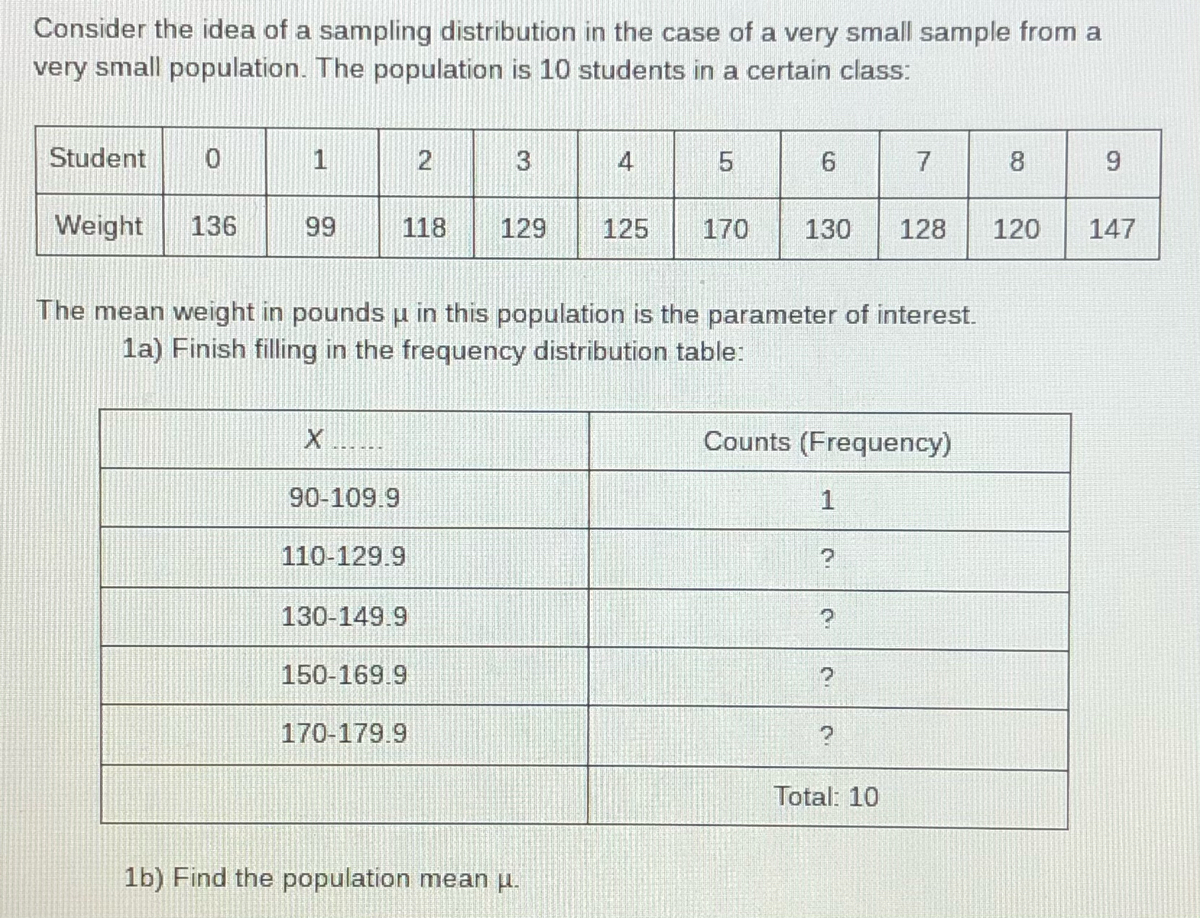

Transcribed Image Text:Consider the idea of a sampling distribution in the case of a very small sample from a
very small population. The population is 10 students in a certain class:
Student
1
3
4
6.
7
8
9.
Weight
136
99
118
129
125
170
130
128
120
147
The mean weight in pounds u in this population is the parameter of interest.
la) Finish filling in the frequency distribution table:
Counts (Frequency)
90-109.9
1
110-129.9
130-149.9
150-169.9
170-179.9
Total: 10
1b) Find the population mean u.
Expert Solution
This question has been solved!
Explore an expertly crafted, step-by-step solution for a thorough understanding of key concepts.

Step by stepSolved in 2 steps

Knowledge Booster


Learn more about
Need a deep-dive on the concept behind this application? Look no further. Learn more about this topic, statistics and related others by exploring similar questions and additional content below.Similar questions
- Construct a frequency distribution for the data using five classes. Describe the shape of the distribution The ages of dishwashers (in years) in 20 randomly selected households are shown below 12 6 4 9 11 1 8 9 8 13 5 15 7 6 8 8 2 1 O A. bell shaped O B. skewed to the right O C. skewed to the left D. uniform Click to select your answerarrow_forwardConstruct a grouped frequency distribution for the data to the right, showing the length, in miles, of 25 rivers. Use five classes that have the same width. Select the correct choice below and fill in any answer boxes within your choice. OA. Length Frequency 500-999 1000-1399 1400-2099 2100-2499 2500-2999 B. …… Length 500-999 1000-1499 1500-1999 2000-2499 2500-2999 Frequency 2650 1460 1270 911 751 2620 1980 1870 1870 1450 1340 1280 1450 1150 1070 970 925 891 859 790 770 717 688 660 642 Length Frequency 500-899 900-1499 1500-1999 2000-2299 2300-3000 3arrow_forwardThe data below are total home game playing times (hours) for all Major League Baseball teams in a recent year. 236 237 238 239 241 249 250 250 | 250 | 251 252 252 253 253 258 258 258 260 262 264 241 242 245 245 245 246 247 247 248 248 Construct a frequency distribution. Use a class width of 5 hours and use a starting time of 235 hours. Page 11 of 12arrow_forward
- Use the indicated data to construct the frequency distribution. Weights of respondents were recorded as part of the California Health Interview Survey. The last digits of weights from 50 randomly selected respondents are listed below. Construct a frequency distribution with 10 classes. Based on the distribution, do the heights appear to be reported or actually measured? What do you know about the accuracy of the results? 5 0 1 0 2 0 5 0 5 0 3 8 5 0 5 0 5 6 0 0 0 0 0 0 8 5 5 0 4 5 0 0 4 0 0 0 0 0 8 0 9 5 3 0 5 0 0 0 5 8 PLEASE SHOW ALL WORK!!!arrow_forwardA sample of 15 boy scouts was selected and their weights (in pounds) were recorded in the table below. Construct a frequency distribution to answer the following questions. 97 120 137 124 117 108 134 126 123 106 130 110 100 120 140 a. Using the class width of 10 give the upper and lower limit for five classes, starting with lower limit of 95 for the first class b. Construct a frequency distribution for the dataarrow_forwardNeed help with parts C & D The proportion of Americans who have frequent migraines is 15.2% according to the CDC. An acupuncturist claims that her treatment can reduce this figure significantly. A random sample of 191 Americans is administered the acupuncturists treatment and 25 report experiencing migraines.a. State Hypotheses to the scenario using the correct symbols. b. What is the sample proportion? (Round to 2 decimal places) ˆpp^= c. Suppose the P-value is calculated to be 0.0318What would your decision be for this test using α=α= 0.025? fail to reject the null accept the null reject the null d. Write a conclusion in terms of the acupuncturist's claim. Use the model provided by the instructor. Assume no errors were made.arrow_forward
- In a survey of 35 families in a village, the number of children per family was recorded and the following data obtained: 1 0. 3 4 5. 6. 7. 8 2 3. 4 0. be ries ring 8. 4 12 6. 3. 6. 3 3. 7. 8. 6. 7. 9. 4 3 Represent the data in the form of a discrete frequency distribution. 2. 4- 5 5arrow_forwardExamine the frequency distribution. What is the width of a class in this frequency distribution? Enter your answer as a number, like this: 42arrow_forwardConstruct a frequency distribution for the data using five classes. Describe the shape of the distribution. The ages of dishwashers (in years) in 20 randomly selected households are shown below. 9 13 5 15 12 6 4 9 11 1 7 898 7 6 8 8 21 OA. bell shaped OB. skewed to the left OC. skewed to the right O D. uniformarrow_forward
- The data given below is for 327 randomly selected 10-minute intervals, where the number of people entering the atrium of a large mall were recorded. Calculate the class width. Number of Frequency Guests 60 – 79 97 S0 – 99 93 100 – 119 21 120 – 139 98 140 - 159 18 Class width %3Darrow_forwardConstruct a frequency distribution and a frequency histogram for the data set using the indicated number of classes. Describe any patterns. Number of classes: 8 Data set: Finishing times (in seconds) of 20 male participants in a 5K race 1718 1632 1571 1470 2300 1445 1249 1800 1593 1778 1960 1524 1824 1620 1306 1819 2020 2082 1580 1481 ..... Construct a frequency distribution of the data. Use the minimum data entry as the lower limit of the first class. Class Frequency 1. nothing-nothing nothing 2. nothing-nothing nothing 3. nothing-nothing nothing 4. nothing-nothing nothing 5. nothing-nothing nothing 6. nothing-nothing nothing 7. nothing-nothing nothing 8. nothing-nothing nothing Construct a frequency histogram of the data. A. 12345678048ClassFrequency A frequency…arrow_forwardAnswer D for mearrow_forward
arrow_back_ios
SEE MORE QUESTIONS
arrow_forward_ios
Recommended textbooks for you
- MATLAB: An Introduction with ApplicationsStatisticsISBN:9781119256830Author:Amos GilatPublisher:John Wiley & Sons Inc
 Probability and Statistics for Engineering and th...StatisticsISBN:9781305251809Author:Jay L. DevorePublisher:Cengage Learning
 Statistics for The Behavioral Sciences (MindTap C...StatisticsISBN:9781305504912Author:Frederick J Gravetter, Larry B. WallnauPublisher:Cengage Learning
  Elementary Statistics: Picturing the World (7th E...StatisticsISBN:9780134683416Author:Ron Larson, Betsy FarberPublisher:PEARSON
 The Basic Practice of StatisticsStatisticsISBN:9781319042578Author:David S. Moore, William I. Notz, Michael A. FlignerPublisher:W. H. Freeman
 Introduction to the Practice of StatisticsStatisticsISBN:9781319013387Author:David S. Moore, George P. McCabe, Bruce A. CraigPublisher:W. H. Freeman
MATLAB: An Introduction with Applications
Statistics
ISBN:9781119256830
Author:Amos Gilat
Publisher:John Wiley & Sons Inc
Probability and Statistics for Engineering and th...
Statistics
ISBN:9781305251809
Author:Jay L. Devore
Publisher:Cengage Learning
Statistics for The Behavioral Sciences (MindTap C...
Statistics
ISBN:9781305504912
Author:Frederick J Gravetter, Larry B. Wallnau
Publisher:Cengage Learning
Elementary Statistics: Picturing the World (7th E...
Statistics
ISBN:9780134683416
Author:Ron Larson, Betsy Farber
Publisher:PEARSON
The Basic Practice of Statistics
Statistics
ISBN:9781319042578
Author:David S. Moore, William I. Notz, Michael A. Fligner
Publisher:W. H. Freeman
Introduction to the Practice of Statistics
Statistics
ISBN:9781319013387
Author:David S. Moore, George P. McCabe, Bruce A. Craig
Publisher:W. H. Freeman