
MATLAB: An Introduction with Applications
6th Edition
ISBN: 9781119256830
Author: Amos Gilat
Publisher: John Wiley & Sons Inc
expand_more
expand_more
format_list_bulleted
Related questions
Question
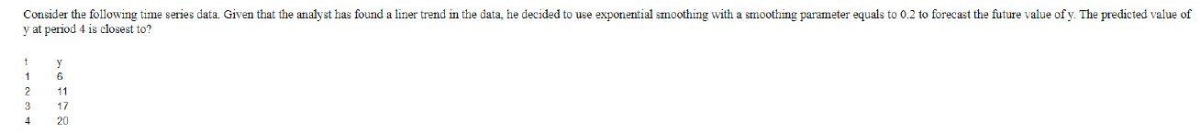

Transcribed Image Text:Consider the following time series data. Given that the analyst has found a liner trend in the data, he decided to use exponential smoothing with a smoothing parameter equals to 0.2 to forecast the future value of y. The predicted value of
y at period 4 is closest to?
1
6
11
3
17
20
Expert Solution
This question has been solved!
Explore an expertly crafted, step-by-step solution for a thorough understanding of key concepts.

Step by stepSolved in 2 steps with 1 images

Knowledge Booster


Learn more about
Need a deep-dive on the concept behind this application? Look no further. Learn more about this topic, statistics and related others by exploring similar questions and additional content below.Similar questions
- Section 10.2 Question #7 Listed below are systolic blood pressure measurements (in mm Hg) obtained from the same woman. Find the regression equation, letting the right arm blood pressure be the predictor (x) variable. Find the best predicted systolic blood pressure in the left arm given that the systolic blood pressure in the right arm is 85mm Hg. Use a significance level of 0.05. Right Arm 103 102 96 79 79 Left Arm 174 167 147 143 145 View the critical values of the Pearson correlation coefficient r Data table Dialog content starts Critical Values of the Pearson Correlation Coefficient r n α=0.05 α=0.01 NOTE: To test H0: ρ=0 against H1: ρ≠0,reject H0 if the absolute value of r is greater than the critical value in the table. 4 0.950 0.990 5 0.878 0.959 6 0.811 0.917 7 0.754 0.875 8 0.707 0.834 9 0.666 0.798 10 0.632 0.765 11 0.602 0.735 12 0.576…arrow_forward1.8 Compute and compare the total electricity consumption of Sub-Saharan Africa to the United States in 2012. The population of Sub-Saharan Africa was 926 million, and the United States was 314 million. The per person consumption in the United States in 2012 was 12.96 MWh per year. Consult Fig. 1.11 for the per person consumption in Sub-Saharan Africa.arrow_forwardConsider the following time series.t 1 2 3 4 5 6 7 Yt 120 110 100 96 94 92 88a. What type of pattern exists in the data?HorizontalSeasonal with upward trendDownward trendUpward trendSeasonal with downward trendb. Regression analysis yields the following forecast equation: 119.71 - 4.929t; what is the forecast for period 8? Round to the nearest hundredth.c. Regression analysis yields the following forecast equation: 119.71 - 4.929t; what is the MSE for this forecast method? Round to the nearest hundredth.arrow_forward
- Ten years of monthly data of a seasonally adjusted series are used to estimate a linear trend model as T = 24.10+ 0.32t. In addition, seasonal indices for January and February are calculated as 1.08 and 0.97, respectively. Make a forecast for the first two months of next year. (Do not round intermediate calculations. Round your answers to 2 decimal places.) ýt January Februaryarrow_forwardConsider the following quarterly time series. Quarter 1 2 3 4 Year 1 923 Year 2 1,112 1,056 1,156 992 Year 3 1,078 1,243 1,124 1,124 1,254 1,301 1,198 a. Construct a time series plot. What type of pattern exists in the data? b. Use a multiple regression model with dummy variables as follows to develop an equation to account for seasonal effects in the data. Qtr1 = 1 if quarter 1, 0 otherwise; Qtr2 = 1 if quarter 2, 0 otherwise; Qtr3 = 1 if quarter 3, 0 otherwise. c. Compute the quarterly forecasts for next year based on the model developed in part b.arrow_forwardQ20arrow_forward
- Consider the time series data in the table below (a-c all count as one problem) a. Construct a time series plot. What type of pattern exists in the data?b. Develop a three-week moving average for this time series. Compute MSEand a forecast for week 8. c. Use α = 0.2 to compute the exponential smoothing value for the time series.Compute MSE and a forecast for week 8.arrow_forwardWhich of the following applies the concept of “layering” to increase the sensitivity of a research analysis? Group of answer choices a. Chi-square Contingency Tables b. Binary Logistic Regression c. Regression d. Answers 1 and 2 only e. Answers 1, 2 and 3arrow_forward
arrow_back_ios
arrow_forward_ios
Recommended textbooks for you
- MATLAB: An Introduction with ApplicationsStatisticsISBN:9781119256830Author:Amos GilatPublisher:John Wiley & Sons Inc
 Probability and Statistics for Engineering and th...StatisticsISBN:9781305251809Author:Jay L. DevorePublisher:Cengage Learning
 Statistics for The Behavioral Sciences (MindTap C...StatisticsISBN:9781305504912Author:Frederick J Gravetter, Larry B. WallnauPublisher:Cengage Learning
  Elementary Statistics: Picturing the World (7th E...StatisticsISBN:9780134683416Author:Ron Larson, Betsy FarberPublisher:PEARSON
 The Basic Practice of StatisticsStatisticsISBN:9781319042578Author:David S. Moore, William I. Notz, Michael A. FlignerPublisher:W. H. Freeman
 Introduction to the Practice of StatisticsStatisticsISBN:9781319013387Author:David S. Moore, George P. McCabe, Bruce A. CraigPublisher:W. H. Freeman
MATLAB: An Introduction with Applications
Statistics
ISBN:9781119256830
Author:Amos Gilat
Publisher:John Wiley & Sons Inc
Probability and Statistics for Engineering and th...
Statistics
ISBN:9781305251809
Author:Jay L. Devore
Publisher:Cengage Learning
Statistics for The Behavioral Sciences (MindTap C...
Statistics
ISBN:9781305504912
Author:Frederick J Gravetter, Larry B. Wallnau
Publisher:Cengage Learning
Elementary Statistics: Picturing the World (7th E...
Statistics
ISBN:9780134683416
Author:Ron Larson, Betsy Farber
Publisher:PEARSON
The Basic Practice of Statistics
Statistics
ISBN:9781319042578
Author:David S. Moore, William I. Notz, Michael A. Fligner
Publisher:W. H. Freeman
Introduction to the Practice of Statistics
Statistics
ISBN:9781319013387
Author:David S. Moore, George P. McCabe, Bruce A. Craig
Publisher:W. H. Freeman