
MATLAB: An Introduction with Applications
6th Edition
ISBN: 9781119256830
Author: Amos Gilat
Publisher: John Wiley & Sons Inc
expand_more
expand_more
format_list_bulleted
Related questions
Question

Transcribed Image Text:K
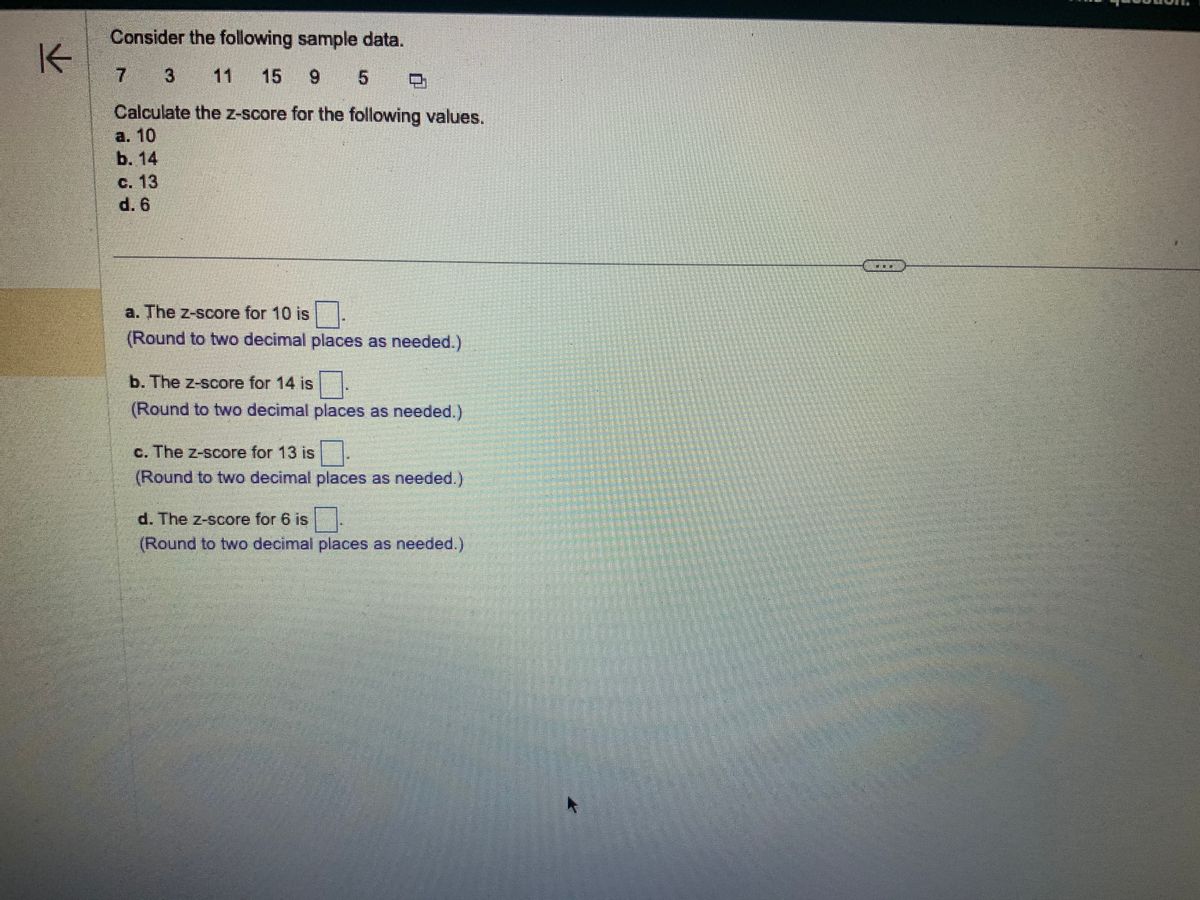
Consider the following sample data.
3
15 9 5
Calculate the z-score for the following values.
a. 10
b. 14
C. 13
d. 6
a. The z-score for 10 is
(Round to two decimal places as needed.)
b. The z-score for 14 is
(Round to two decimal places as needed.)
c. The z-score for 13 is.
(Round to two decimal places as needed.)
d. The z-score for 6 is
(Round to two decimal places as needed.)
Expert Solution
arrow_forward
Step 1: Introduction:
Hi! Thank you for the question. As per the honor code, we are allowed to answer three sub-parts at a time so we are answering the first three as you have not mentioned which of these you are looking for. Please re-submit the question separately for the remaining sub-parts.
z-score: The z-score is a statistical measurement that measures the dispersion of data.
We calculate it by subtracting the value of the mean and dividing the numerator by the standard deviation.
The formula for computing the z-score:
Here,
z is the standard score
x is the observed value
is the sample mean
is the sample standard deviation

Step by stepSolved in 5 steps

Knowledge Booster

Similar questions
- How is a sample related to a population? Choose the correct answer below. OA. A sample is a subset of a population. OB. A sample is a numerical measure that describes a sample characteristic. OC. A sample is the collection of all outcomes, responses, measurements, or counts.arrow_forwardFor the following scores from a sample: a. Compute the mean, median and mode for the scores. b. Compute the SS, variance and SD. X f 7 1 6 2 5 2 4 2 3 1 MacBook Airarrow_forwardHere is a set of sample data. 96 52 19 97 98 67 93 45 57 41 89 60 66 5 42 32 71 73 90 33 53 35 24 85 9 75 Base on the data above, identify the 5 number summary , , , ,arrow_forward
- Here is a set of sample data. 20 70 2 35 41 42 34 46 49 55 75 71 48 93 21 18 22 88 68 86 76 78 1 37 77 15 Base on the data above, identify the 5 number summary 1,21.5×, 46 X, 73 X, 93 ✓arrow_forwardGiven the following dataset which represents a sample ( n = 8) from a larger population: 188 122 147 45 66 190 167 91 What is the median?arrow_forwardFind the population mean or sample mean as indicated. Population: 6, 9, 3, 12, 14, 16 O A. x=11 OB. x= 12 O C. µ= 13 ΟD. μ= 10arrow_forward
arrow_back_ios
arrow_forward_ios
Recommended textbooks for you
- MATLAB: An Introduction with ApplicationsStatisticsISBN:9781119256830Author:Amos GilatPublisher:John Wiley & Sons Inc
 Probability and Statistics for Engineering and th...StatisticsISBN:9781305251809Author:Jay L. DevorePublisher:Cengage Learning
 Statistics for The Behavioral Sciences (MindTap C...StatisticsISBN:9781305504912Author:Frederick J Gravetter, Larry B. WallnauPublisher:Cengage Learning
  Elementary Statistics: Picturing the World (7th E...StatisticsISBN:9780134683416Author:Ron Larson, Betsy FarberPublisher:PEARSON
 The Basic Practice of StatisticsStatisticsISBN:9781319042578Author:David S. Moore, William I. Notz, Michael A. FlignerPublisher:W. H. Freeman
 Introduction to the Practice of StatisticsStatisticsISBN:9781319013387Author:David S. Moore, George P. McCabe, Bruce A. CraigPublisher:W. H. Freeman
MATLAB: An Introduction with Applications
Statistics
ISBN:9781119256830
Author:Amos Gilat
Publisher:John Wiley & Sons Inc
Probability and Statistics for Engineering and th...
Statistics
ISBN:9781305251809
Author:Jay L. Devore
Publisher:Cengage Learning
Statistics for The Behavioral Sciences (MindTap C...
Statistics
ISBN:9781305504912
Author:Frederick J Gravetter, Larry B. Wallnau
Publisher:Cengage Learning
Elementary Statistics: Picturing the World (7th E...
Statistics
ISBN:9780134683416
Author:Ron Larson, Betsy Farber
Publisher:PEARSON
The Basic Practice of Statistics
Statistics
ISBN:9781319042578
Author:David S. Moore, William I. Notz, Michael A. Fligner
Publisher:W. H. Freeman
Introduction to the Practice of Statistics
Statistics
ISBN:9781319013387
Author:David S. Moore, George P. McCabe, Bruce A. Craig
Publisher:W. H. Freeman