
MATLAB: An Introduction with Applications
6th Edition
ISBN: 9781119256830
Author: Amos Gilat
Publisher: John Wiley & Sons Inc
expand_more
expand_more
format_list_bulleted
Related questions
Question
thumb_up100%
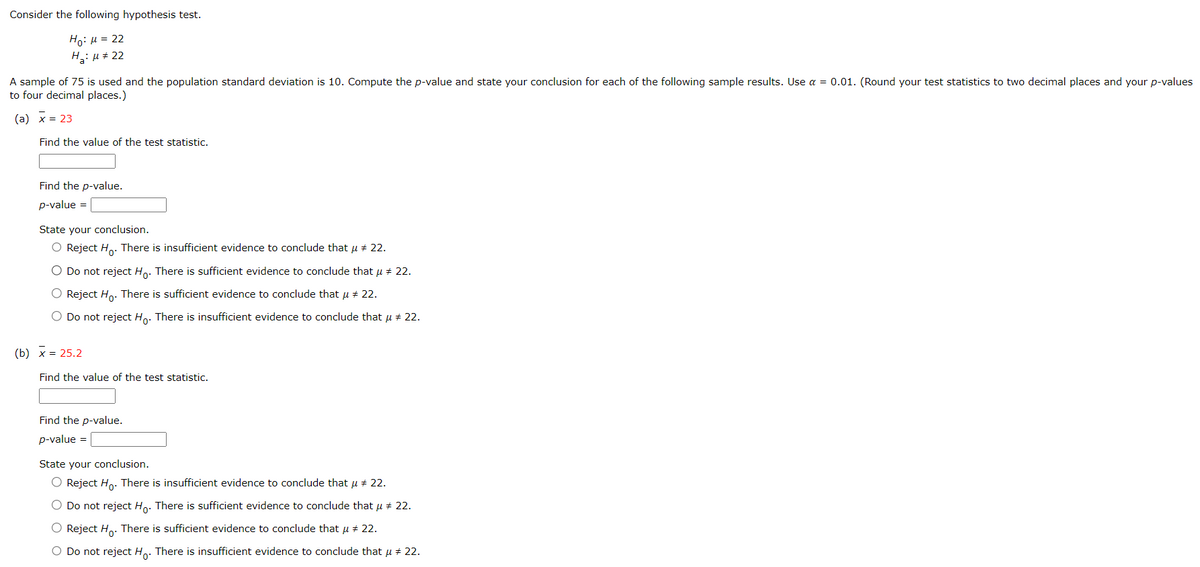

Transcribed Image Text:Consider the following hypothesis test.
Ho: μ = 22
H₂:μ # 22
A sample of 75 is used and the population standard deviation is 10. Compute the p-value and state your conclusion for each of the following sample results. Use α = 0.01. (Round your test statistics to two decimal places and your p-values
to four decimal places.)
(a) x = 23
Find the value of the test statistic.
Find the p-value.
p-value =
State your conclusion.
O Reject Ho. There is insufficient evidence to conclude that μ # 22.
O Do not reject Ho. There is sufficient evidence to conclude that μ ‡ 22.
O Reject Ho. There is sufficient evidence to conclude that μ # 22.
O Do not reject Ho. There is insufficient evidence to conclude that μ # 22.
(b) x = 25.2
Find the value of the test statistic.
Find the p-value.
p-value =
State your conclusion.
O Reject Ho. There is insufficient evidence to conclude that μ # 22.
O Do not reject Ho. There is sufficient evidence to conclude that μ ‡ 22.
O Reject Ho. There is sufficient evidence to conclude that μ # 22.
O Do not reject Ho. There is insufficient evidence to conclude that μ ‡ 22.

Transcribed Image Text:(c) x = 20
Find the value of the test statistic.
Find the p-value.
p-value =
State your conclusion.
Reject Ho. There is insufficient evidence to conclude that μ # 22.
O Do not reject Ho. There is sufficient evidence to conclude that μ # 22.
Reject Ho. There is sufficient evidence to conclude that μ # 22.
Do not reject Ho. There is insufficient evidence to conclude that μ # 22.
Expert Solution
This question has been solved!
Explore an expertly crafted, step-by-step solution for a thorough understanding of key concepts.

This is a popular solution

Trending nowThis is a popular solution!

Step by stepSolved in 5 steps with 3 images

Knowledge Booster

Similar questions
- answer 2arrow_forwardYou want to obtain a sample to estimate a population mean. Based on previous evidence, you believe the population standard deviation is approximately σ=71.8σ=71.8. You would like to be 99% confident that your estimate is within 2.5 of the true population mean. How large of a sample size is required? n =arrow_forwardYou wish to test the following claim (Ha) at a significance level of a=0.02. H0: u=83.9 Ha:u<83.9 You believe the population is normally distributed but you do not know the standard deviation. You obtain a sample of size n=119 with the meanM=79.4 and a standard deviation of SD=12.9. What is the test statistic foe this sample? What is the P value for this sample? The p value is less than or greater than a? This test statistic leads to a decision to: reject the null, accept the null, or fail to reject the null?arrow_forward
- ES We want to conduct a hypothesis test of the claim that the population mean germination time of strawberry seeds is different from 19.2 days. So, we choose a random sample of strawberries. The sample has a mean of 19 days and a standard deviation of 1.4 days. For each of the following sampling scenarios, choose an appropriate test statistic for our hypothesis test on the population mean. Then calculate that statistic. Round your answers to two decimal places. (a) The sample has size 19, and it is from a normally distributed population with an unknown standard deviation. O z = t = It is unclear which test statistic to use. (b) The sample has size 16, and it is from a population with a distribution about which we know very little. = Z t = It is unclear which test statistic to use.arrow_forwardYou want to obtain a sample to estimate a population mean. Based on previous evidence, you believe the population standard deviation is approximately σ=72.1σ=72.1. You would like to be 99% confident that your estimate is within 2 of the true population mean. How large of a sample size is required?arrow_forwardanswer 1arrow_forward
- Need help finding what t= toarrow_forwardanswer 3arrow_forwardThe output below is for a t-test for the hypothesis: Individuals living in bad neighborhoods commit more crime than those living in good neighborhoods. The data in the Group Statistics section provides you with the average number of crimes committed by individuals living in good and bad neighborhoods and the standard deviation of this same variable. The findings of significance are located in the Independent Samples Test section. Pay particular attention to the "t" column and the "Sig (2-tailed)"column. The "t" column is the t value that you would have calculated by hand (as we learned in class). The "Sig (2-tailed)"column provides you with the p value (the level of significance of this relationship). In this column, any value below .05 indicates that you would have rejected your null hypothesis. 1. Can someone tell me about the relationship of all these data? I'm trying to determine if my hypothesis, listed below, can be proven or disproven? 2. What is the independent variable and…arrow_forward
- If someone could help me answer this that would be great.arrow_forwardYou want to obtain a sample to estimate a population mean. Based on previous evidence, you believe the population standard deviation is approximately σ=21.8σ=21.8. You would like to be 98% confident that your estimate is within 0.8 of the true population mean. How large of a sample size is required?n = Do not round mid-calculation.arrow_forwardYou want to obtain a sample to estimate a population mean. Based on previous evidence, you believe the population standard deviation is approximately σ=40.4σ=40.4. You would like to be 90% confident that your estimate is within 1.5 of the true population mean. How large of a sample size is required? n=arrow_forward
arrow_back_ios
arrow_forward_ios
Recommended textbooks for you
- MATLAB: An Introduction with ApplicationsStatisticsISBN:9781119256830Author:Amos GilatPublisher:John Wiley & Sons Inc
 Probability and Statistics for Engineering and th...StatisticsISBN:9781305251809Author:Jay L. DevorePublisher:Cengage Learning
 Statistics for The Behavioral Sciences (MindTap C...StatisticsISBN:9781305504912Author:Frederick J Gravetter, Larry B. WallnauPublisher:Cengage Learning
  Elementary Statistics: Picturing the World (7th E...StatisticsISBN:9780134683416Author:Ron Larson, Betsy FarberPublisher:PEARSON
 The Basic Practice of StatisticsStatisticsISBN:9781319042578Author:David S. Moore, William I. Notz, Michael A. FlignerPublisher:W. H. Freeman
 Introduction to the Practice of StatisticsStatisticsISBN:9781319013387Author:David S. Moore, George P. McCabe, Bruce A. CraigPublisher:W. H. Freeman
MATLAB: An Introduction with Applications
Statistics
ISBN:9781119256830
Author:Amos Gilat
Publisher:John Wiley & Sons Inc
Probability and Statistics for Engineering and th...
Statistics
ISBN:9781305251809
Author:Jay L. Devore
Publisher:Cengage Learning
Statistics for The Behavioral Sciences (MindTap C...
Statistics
ISBN:9781305504912
Author:Frederick J Gravetter, Larry B. Wallnau
Publisher:Cengage Learning
Elementary Statistics: Picturing the World (7th E...
Statistics
ISBN:9780134683416
Author:Ron Larson, Betsy Farber
Publisher:PEARSON
The Basic Practice of Statistics
Statistics
ISBN:9781319042578
Author:David S. Moore, William I. Notz, Michael A. Fligner
Publisher:W. H. Freeman
Introduction to the Practice of Statistics
Statistics
ISBN:9781319013387
Author:David S. Moore, George P. McCabe, Bruce A. Craig
Publisher:W. H. Freeman