
MATLAB: An Introduction with Applications
6th Edition
ISBN: 9781119256830
Author: Amos Gilat
Publisher: John Wiley & Sons Inc
expand_more
expand_more
format_list_bulleted
Related questions
Question
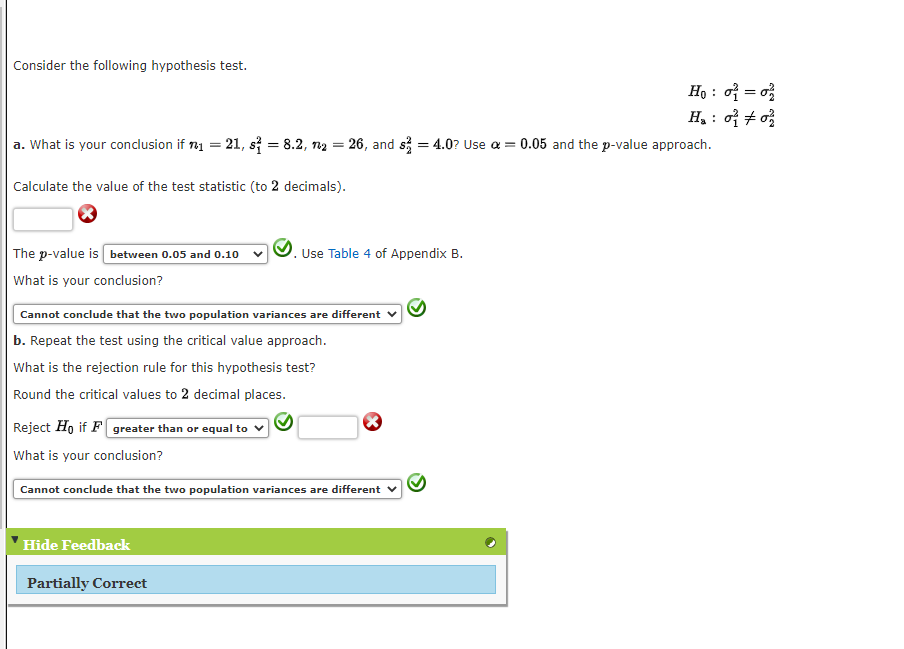

Transcribed Image Text:Consider the following hypothesis test.
a. What is your conclusion if
=
Calculate the value of the test statistic (to 2 decimals).
21, s = 8.2, n₂ = 26, and s=4.0? Use a =
The p-value is between 0.05 and 0.10
What is your conclusion?
Cannot conclude that the two population variances are different
b. Repeat the test using the critical value approach.
What is the rejection rule for this hypothesis test?
Round the critical values to 2 decimal places.
Reject Ho if F greater than or equal to ✓
What is your conclusion?
Hide Feedback
Partially Correct
Use Table 4 of Appendix B.
Cannot conclude that the two population variances are different
Ho: ₁ = 0
H₂: 002/
0.05 and the p-value approach.
Expert Solution
This question has been solved!
Explore an expertly crafted, step-by-step solution for a thorough understanding of key concepts.

This is a popular solution

Trending nowThis is a popular solution!

Step by stepSolved in 2 steps

Follow-up Questions
Read through expert solutions to related follow-up questions below.
Follow-up Question
Did not answer question.
Solution
by Bartleby Expert
Follow-up Questions
Read through expert solutions to related follow-up questions below.
Follow-up Question
Did not answer question.
Solution
by Bartleby Expert
Knowledge Booster

Similar questions
- If the test requires that the results be statistically significant at a level of α = 0.05, fill in the blanks and complete the sentences that explain the test decision and conclusion. The decision is to reject the null hypothesis. There is enough evidence at a significance level of a = 0.05 that the mean weight for U.S. women of age 40-49 who smoke daily is less than 169.976 pounds.arrow_forwardProfessor Nord stated that the mean score on the final exam from all the years he has been teaching is a 79%. Colby was in his most recent class, and his class’s mean score on the final exam was 82%. Colby decided to run a hypothesis test to determine if the mean score of his class was significantly greater than the mean score of the population. α = .01. What is the mean score of the population? What is the mean score of the sample? Is this test one-tailed or two-tailed? Why?arrow_forwardYou wish to test the following claim (HaHa) at a significance level of α=0.005α=0.005. Ho:μ=52.8Ho:μ=52.8 Ha:μ<52.8Ha:μ<52.8You believe the population is normally distributed, but you do not know the standard deviation. You obtain the following sample of data: Column A Column B Column C Column D Column E 68.6 49.4 55.1 46.6 37.3 64.7 53.4 56.9 49.1 42.7 59.3 51.5 44.1 44.8 43.8 46 56.9 64.7 51.8 47.7 53.4 50.5 50.2 37.9 41.6 56.6 58.9 35.2 53.4 56.3 50.7 49.9 61.2 75.9 56 42 65.4 48 56.3 51.8 51 45.4 55.4 54.6 59.6 45.7 71.1 61.2 75.9 53.7 51.5 44.8 56.6 26.1 49.1 32.3 75.9 55.1 53.7 75.9 What is the test statistic for this sample? (Report answer accurate to three decimal places.)test statistic = What is the p-value for this sample? (Report answer accurate to four decimal places.)p-value = The p-value is... less than (or equal to) αα greater than αα This test statistic leads to a decision to... reject the null accept the null fail…arrow_forward
- You wish to test the following claim (��) at a significance level of �=0.002. ��:�1=�2 ��:�1≠�2You believe both populations are normally distributed, but you do not know the standard deviations for either. However, you also have no reason to believe the variances of the two populations are not equal. You obtain the following two samples of data. Sample #1 Sample #2 50.2 77.2 87.1 65 64.2 58.4 78 60.5 72.6 53.1 51.2 75.6 64.2 93.6 68.6 63.8 71.9 74.9 74.5 54.6 59.2 61.8 90.1 73.6 55.4 62.6 68.6 71.6 67.9 87.3 51.9 85.2 81.3 76.3 54 59.6 59.6 88.6 50.8 What is the test statistic for this sample? (Report answer accurate to three decimal places.)test statistic = What is the p-value for this sample? For this calculation, use the degrees of freedom reported from the technology you are using. (Report answer accurate to four decimal places.)p-value =arrow_forwardChoose the appropriate statistical test. When computing, be sure to round each answer as indicated. A dentist wonders if depression affects ratings of tooth pain. In the general population, using a scale of 1-10 with higher values indicating more pain, the average pain rating for patients with toothaches is 6.8. A sample of 30 patients that show high levels of depression have an average pain rating of 7.1 (variance 0.8). What should the dentist determine? 1. Calculate the estimated standard error. (round to 3 decimals). [st.error] 2. What is thet-obtained? (round to 3 decimals). 3. What is the t-cv? (exact value) 4. What is your conclusion? Only type "Reject" or Retain"arrow_forwardeconometricsarrow_forward
- You are conducting a hypothesis test on the body weights of male fraternity members. The research (alternative) hypothesis is that the averge weight is less than 200 lbs. Your test will be at the 0.01 significance level. You take a sample of 100 men, and find that the sample average is 210 lbs, and the standard error is 2 lbs. What is the value of your test statistic? (Please answer to two decimal places. ex: 5.43)arrow_forwardYou wish to test the following claim (HaHa) at a significance level of α=0.05α=0.05. Ho:μ=63.7Ho:μ=63.7 Ha:μ<63.7Ha:μ<63.7You believe the population is normally distributed, but you do not know the standard deviation. You obtain the following sample of data: Column A Column B Column C Column D 66.7 56.1 82.1 74.8 60.4 57.5 55.2 52.4 74.8 56.1 83.6 98 49.5 33.7 83.6 44.9 27.3 29.8 39 92.9 42.2 29.8 25.8 42.7 64.5 69.7 58 38.4 76.6 50.9 57.5 69.7 47 43.9 65 67.8 What is the critical value for this test? (Report answer accurate to three decimal places.)critical value = What is the test statistic for this sample? (Report answer accurate to three decimal places.)test statistic =arrow_forwardFind the p-value that corresponds to the given standard score, and determine whether to reject the null hypothesis at the 0.10 significance level. Is the alternative hypothesis supported? Z= 0.9 for H0: u=136 pounds and Ha: u is not = 136 pounds. The p-value is ?arrow_forward
- Consider the following hypothesis test. Ho: H1 - H2 = 0 Ha: H1 - 42 # 0 The following results are from independent samples taken from two populations assuming the variances are unequal. Sample 1 Sample 2 n1 35 = 40 = 13.6 X, = 10.1 S1 5.8 S2 = 8.1 (a) What is the value of the test statistic? (Use x, - x2. Round your answer to three decimal places.) (b) What is the degrees of freedom for the t distribution? (Round your answer down to the nearest integer.) (c) What is the p-value? (Round your answer to four decimal places.) p-value = (d) At a = 0.05, what is your conclusion? Do not Reject Ho: There is sufficient evidence to conclude that u, - µ, ± 0. Reject Ho. There is sufficient evidence to conclude that µ, - µ, # 0. Do not Reject Ho. There is insufficient evidence to conclude that u, - H, + 0. 0' Reject Ho. There is insufficient evidence to conclude that u1 - µ2 ± 0.arrow_forwardYou wish to test the following claim (HaHa) at a significance level of α=0.02α=0.02. Ho:μ=70.6Ho:μ=70.6 Ha:μ≠70.6Ha:μ≠70.6You believe the population is normally distributed, but you do not know the standard deviation. You obtain the following sample of data: data 113.7 91.9 98.1 112.8 What is the test statistic for this sample? (Report answer accurate to three decimal places.)test statistic = What is the p-value for this sample? (Report answer accurate to four decimal places.)p-value = The p-value is... less than (or equal to) αα greater than αα This test statistic leads to a decision to... reject the null accept the null fail to reject the null As such, the final conclusion is that... There is sufficient evidence to warrant rejection of the claim that the population mean is not equal to 70.6. There is not sufficient evidence to warrant rejection of the claim that the population mean is not equal to 70.6. The sample data support the claim that the…arrow_forwardwith workarrow_forward
arrow_back_ios
arrow_forward_ios
Recommended textbooks for you
- MATLAB: An Introduction with ApplicationsStatisticsISBN:9781119256830Author:Amos GilatPublisher:John Wiley & Sons Inc
 Probability and Statistics for Engineering and th...StatisticsISBN:9781305251809Author:Jay L. DevorePublisher:Cengage Learning
 Statistics for The Behavioral Sciences (MindTap C...StatisticsISBN:9781305504912Author:Frederick J Gravetter, Larry B. WallnauPublisher:Cengage Learning
  Elementary Statistics: Picturing the World (7th E...StatisticsISBN:9780134683416Author:Ron Larson, Betsy FarberPublisher:PEARSON
 The Basic Practice of StatisticsStatisticsISBN:9781319042578Author:David S. Moore, William I. Notz, Michael A. FlignerPublisher:W. H. Freeman
 Introduction to the Practice of StatisticsStatisticsISBN:9781319013387Author:David S. Moore, George P. McCabe, Bruce A. CraigPublisher:W. H. Freeman
MATLAB: An Introduction with Applications
Statistics
ISBN:9781119256830
Author:Amos Gilat
Publisher:John Wiley & Sons Inc
Probability and Statistics for Engineering and th...
Statistics
ISBN:9781305251809
Author:Jay L. Devore
Publisher:Cengage Learning
Statistics for The Behavioral Sciences (MindTap C...
Statistics
ISBN:9781305504912
Author:Frederick J Gravetter, Larry B. Wallnau
Publisher:Cengage Learning
Elementary Statistics: Picturing the World (7th E...
Statistics
ISBN:9780134683416
Author:Ron Larson, Betsy Farber
Publisher:PEARSON
The Basic Practice of Statistics
Statistics
ISBN:9781319042578
Author:David S. Moore, William I. Notz, Michael A. Fligner
Publisher:W. H. Freeman
Introduction to the Practice of Statistics
Statistics
ISBN:9781319013387
Author:David S. Moore, George P. McCabe, Bruce A. Craig
Publisher:W. H. Freeman