MATLAB: An Introduction with Applications
6th Edition
ISBN: 9781119256830
Author: Amos Gilat
Publisher: John Wiley & Sons Inc
expand_more
expand_more
format_list_bulleted
Question
thumb_up100%

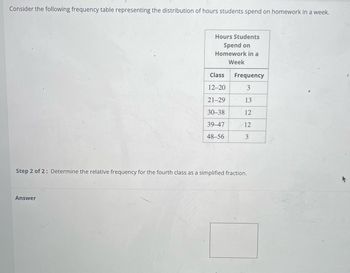
Transcribed Image Text:Consider the following frequency table representing the distribution of hours students spend on homework in a week.
Hours Students
Spend on
Homework in a
Week
Answer
Class Frequency
12-20
3
21-29
13
30-38
12
39-47
12
48-56
3
Step 2 of 2: Determine the relative frequency for the fourth class as a simplified fraction.
Expert Solution
This question has been solved!
Explore an expertly crafted, step-by-step solution for a thorough understanding of key concepts.
This is a popular solution
Trending nowThis is a popular solution!
Step by stepSolved in 3 steps with 5 images

Knowledge Booster
Similar questions
- How do I find the number of classes in a frequency histogram.arrow_forwardFinish times (to the nearest hour) for 10 dogsled teams are shown below. Make a frequency table showing class limits, class boundaries, midpoints, frequency, relative frequencies, and cumulative frequencies. Use three classes. (Round your answer for relative frequency to the nearest hundredth and for midpoint to the nearest tenth.) 308 262 310 268 299 249 257 286 239 278arrow_forwardFind the range for this list of numbers 4 35 58 97 22 29 7 78 11 46 93 66 27 54 Range %3Darrow_forward
- It’s number 17 please I need help making the frequency table and finding the ages of the most common winnersarrow_forwardFinish times (to the nearest hour) for 10 dogsled teams are shown below. Make a frequency table showing class limits, class boundaries, midpoints, frequency, relative frequencies, and cumulative frequencies. Use three classes. The class size of the given data is 24. (Round your answer for relative frequency to the nearest hundredth and for midpoint to the nearest tenth.) 262 236 272 256 294 242 288 258 284 310arrow_forwardThe frequency distribution below explains a group of college student's approximate monthly expenses. Use the data calculate the proportion and percent of each expenses. (round proportion to the nearest thousandths and percent to nearest tenth) TOPPING FREQUENCY PROPORTION PERCENT TOPPING FREQUENCY PROPORTION PERCENT Rent 500 Clothes 150 Commute 125 Food 250 Miscellaneous 75arrow_forward
- Fill in the yellow please.arrow_forwardO E U8 A Sdet jet laen and Gephs kead Only d A kobert Rapch Home Insert Draw Design Layout References Malings Review View Help d Share PComments The bar charts below show the number of refugees admitted to the states by nationality region. Number of refugees admitted each fiscal year into the U.S., in thousands, by region of nationality Africa a Middle East Asla-Pacific Europe Americas 3.000 16.000 11,000 20,000 15,000 6.000 5,000 2,000 2,000 2,000 Lilulla 2002 Note: Fisésl yearstars Oct. 1. See AppendixC for ciassification of countries into reglons Numbers are rounded to the nearest thousand. Source: Pew Research Centeranslysisof U.S. Stste Depsrtment's Retugee Proessing Center data (Demagraphic Prafile), A ccessed Gct. 2, 2017. 2017 2002 2017 2002 2017 2002 2017 2002 2017 *U.S. Reseties Fewer Refugees Evenas Global Numberof Displaced People Grovs" 2 E 5. Summarize what you see in the prior graph (number of refugees each fiscal year admitted into the US by region of nationality) and…arrow_forwardPlease helparrow_forward
arrow_back_ios
arrow_forward_ios
Recommended textbooks for you
 MATLAB: An Introduction with ApplicationsStatisticsISBN:9781119256830Author:Amos GilatPublisher:John Wiley & Sons Inc
 Probability and Statistics for Engineering and th...StatisticsISBN:9781305251809Author:Jay L. DevorePublisher:Cengage Learning
 Statistics for The Behavioral Sciences (MindTap C...StatisticsISBN:9781305504912Author:Frederick J Gravetter, Larry B. WallnauPublisher:Cengage Learning
 Elementary Statistics: Picturing the World (7th E...StatisticsISBN:9780134683416Author:Ron Larson, Betsy FarberPublisher:PEARSON
 The Basic Practice of StatisticsStatisticsISBN:9781319042578Author:David S. Moore, William I. Notz, Michael A. FlignerPublisher:W. H. Freeman
 Introduction to the Practice of StatisticsStatisticsISBN:9781319013387Author:David S. Moore, George P. McCabe, Bruce A. CraigPublisher:W. H. Freeman

MATLAB: An Introduction with Applications
Statistics
ISBN:9781119256830
Author:Amos Gilat
Publisher:John Wiley & Sons Inc

Probability and Statistics for Engineering and th...
Statistics
ISBN:9781305251809
Author:Jay L. Devore
Publisher:Cengage Learning

Statistics for The Behavioral Sciences (MindTap C...
Statistics
ISBN:9781305504912
Author:Frederick J Gravetter, Larry B. Wallnau
Publisher:Cengage Learning

Elementary Statistics: Picturing the World (7th E...
Statistics
ISBN:9780134683416
Author:Ron Larson, Betsy Farber
Publisher:PEARSON

The Basic Practice of Statistics
Statistics
ISBN:9781319042578
Author:David S. Moore, William I. Notz, Michael A. Fligner
Publisher:W. H. Freeman

Introduction to the Practice of Statistics
Statistics
ISBN:9781319013387
Author:David S. Moore, George P. McCabe, Bruce A. Craig
Publisher:W. H. Freeman