
MATLAB: An Introduction with Applications
6th Edition
ISBN: 9781119256830
Author: Amos Gilat
Publisher: John Wiley & Sons Inc
expand_more
expand_more
format_list_bulleted
Related questions
Question
Consider the following four studies below and then match them accordingly to their
sampling type.
Study 1: Henrietta manages a movie theater that recently completed a remodel. She would like to learn what her customers think about it. So she decides to give every 20th person that enters the theater a survey that asks them their opinion of the remodel.
Study 2: Suppose a research team wants to determine the average GPA of college
students in the U.S. They choose to have their sample represent the target population in terms of major and know from a different study that 12% majer in English, 28% major in science, 15% major in computer science, 21% major in engineering, 5% major in
mathematics, 10% major in the arts, and the remaining 9% have a different major. In their sampling procedure they are careful to make sure that their sample has these exact
percentages, in terms of major, by performing a simple random sample within each of
these subgroups.
Study 3: A raffle takes place where attendants are each handed a single ticket number that is placed into a bag and certain prizes are given to the people whose ticket numbers are drawn.
Study 4: A raffle takes place where attendants are able to buy as many tickets as they
would like--each with a number-- that is placed into a bag and certain prizes are given to the people whose ticket numbers are drawn
Study 4:
Study 3:
Study 3:
Study 1:
Choices:
Stratified Random Sample
Other
Systematic Random Sample
Simple Random Sample
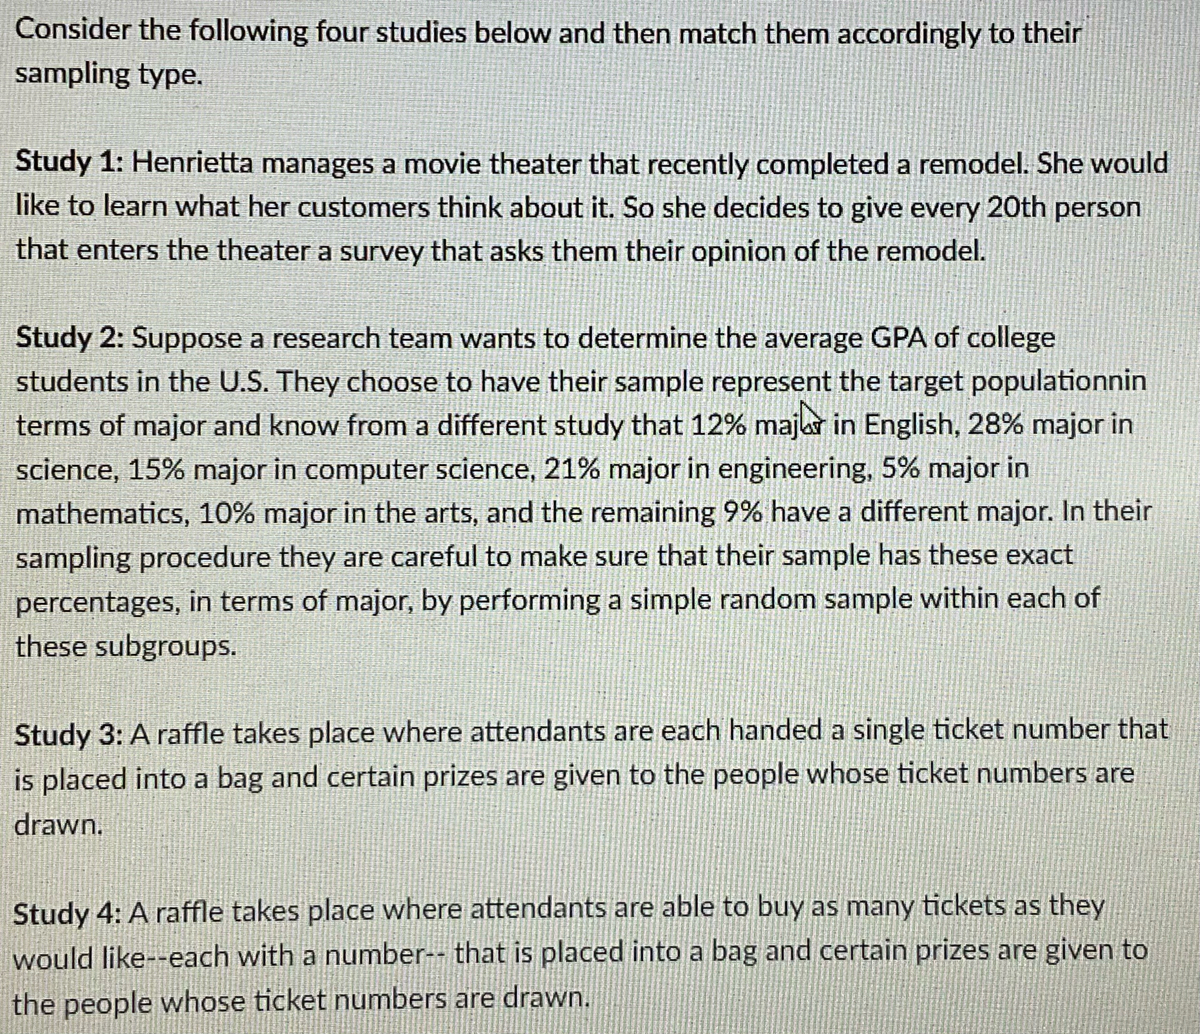

Transcribed Image Text:Consider the following four studies below and then match them accordingly to their
sampling type.
Study 1: Henrietta manages a movie theater that recently completed a remodel. She would
like to learn what her customers think about it. So she decides to give every 20th person
that enters the theater a survey that asks them their opinion of the remodel.
Study 2: Suppose a research team wants to determine the average GPA of college
students in the U.S. They choose to have their sample represent the target populationnin
terms of major and know from a different study that 12% majur in English, 28% major in
science, 15% major in computer science, 21% major in engineering, 5% major in
mathematics, 10% major in the arts, and the remaining 9% have a different major. In their
sampling procedure they are careful to make sure that their sample has these exact
percentages, in terms of major, by performing a simple random sample within each of
these subgroups.
Study 3: A raffle takes place where attendants are each handed a single ticket number that
is placed into a bag and certain prizes are given to the people whose ticket numbers are
drawn.
Study 4: A raffle takes place where attendants are able to buy as many tickets as they
would like--each with a number-- that is placed into a bag and certain prizes are given to
the people whose ticket numbers are drawn.
Expert Solution
This question has been solved!
Explore an expertly crafted, step-by-step solution for a thorough understanding of key concepts.

This is a popular solution

Trending nowThis is a popular solution!

Step by stepSolved in 2 steps

Knowledge Booster

Similar questions
- Matt Gaetz, a health educator, wants to evaluate the effect of a dental film on the frequency with which children brush their teeth. A random selection of 8 children are used for the experiment. First, a baseline of the number of times the children brush their teeth over a month's period is established. Next, the children are shown the dental film and again the number of teeth brushings are recorded for a month. The following data are recorded. Subject 1 2 3 4 5 6 7 8 After Film 28 29 25 30 25 27 28 24 Baseline 25 28 22 30 26 24 25 22 a. What is the null hypothesis? b. What is the alternative hypothesis c. What is your conclusion, using an alpha of 0.05 (2 tailed)?arrow_forwardThe city council of Pine Bluffs is considering increasing the number of police in an effort to reduce crime. Before making a final decision, the council asked the chief of police to survey other cities of similar size to determine the relationship between the number of police and the number of crimes reported. The chief gathered the following sample information. City Oxford Starksville Danville Athens ……….... Police 23 24 30 33 Number of Crimes 18 15 Click here for the Excel Data File 9 11 Number of crimes City Holgate Carey Whistler Woodville > Answer is complete but not entirely correct. 40.6081 X (90.0408) ► x Answer is complete and correct. 19✔ Police 24 20 19 27 a. Determine the regression equation. (Negative amounts should be indicated by a minus sign. Round your answers to 4 decimal places.) Number of Crimes 9 22 24 10 b. Estimate the number of crimes for a city with 21 police officers. (Round your answer to the nearest whole number.)arrow_forward(6) A student surveys some students on campus in the evening and finds that 16 out of 20 of the students she interviewed are part time students. She uses the data to estimate the percentage of all students who are part time. What type of bias is present in her sample?arrow_forward
- Kindly assist with creating bar charts, or pie charts for the below results; The results of this study were based on interviews issued and completed by eleven (11) employees at the Hotel. This research study comprised 31.4% of the total workforce across the three departments, with a total of 35 employees who varied in age from 16 years to above 65 years. 63.6% of individuals who participated were female, while 36% were male. The interviews included participation from 30% of employees in the housekeeping department, 33% from Guest Services, and 31% from the Food and Beverage department. There is a higher representation of females across all departments, with a total of 7 females compared to 4 males. There is a range of tenure lengths, with some employees having just started (1 year) and others having been with the hotel for longer periods (up to 14.5 years).arrow_forwardQUESTION 4 Find the median for the given sample data. The number of vehicles passing through a bank drive- up line during each 15- minute period was recorded. The results are shown below. Find the median number of vehicles going through the line in a fifteen- minute period. 20 22 20 23 23 20 25 22 30 26 26 24 19 26 20 15 10 22 22 22 O 23 22 26 O 21.85 QUESTION 5 Construct a boxplot for the given data. Include values of the 5 -number summary in all boxplots. The weights (in pounds) of 30 newborm babies are listed below. Construct a boxplot for the data set. 5.55.758 5.9 6.1 6.1 63 646.5 6.6 676767K070707.0717272 Save A thmit Click Saue All Answers to save all answers.arrow_forward1. A scientist is studying the effect of exercise on blood pressure. He studies 50 people who exercise regularly to find out whether their blood pressures are low, average, or high. This is an example of a(n): Answer choices: sample survey. observational study. experiment.arrow_forward
- Need help with a review statistics questionarrow_forwardA real-estate appraiser wants to verify the market value for homes on the east side of the city that are very similar to size and style. The appraiser wants to test the popular belief that the average sales price is $37.80 per square foot for such homes. Suppose that a random sample of six sales were selected. The sampled sales prices per square foot are $35.00, $38.10, $37.20, $29.80, $30.30, and $35.40. Assuming a normal distribution is a good model for sales, test the claim that the mean sales price per square foot differs from $37.80 at the 1% significance level.arrow_forward(6) A student surveys some students on campus in the evening and finds that 16 out of 20 of the students she interviewed are part time students. She uses the data to estimate the percentage of all students who are part time. What type of bias is present in her sample?arrow_forward
arrow_back_ios
arrow_forward_ios
Recommended textbooks for you
- MATLAB: An Introduction with ApplicationsStatisticsISBN:9781119256830Author:Amos GilatPublisher:John Wiley & Sons Inc
 Probability and Statistics for Engineering and th...StatisticsISBN:9781305251809Author:Jay L. DevorePublisher:Cengage Learning
 Statistics for The Behavioral Sciences (MindTap C...StatisticsISBN:9781305504912Author:Frederick J Gravetter, Larry B. WallnauPublisher:Cengage Learning
  Elementary Statistics: Picturing the World (7th E...StatisticsISBN:9780134683416Author:Ron Larson, Betsy FarberPublisher:PEARSON
 The Basic Practice of StatisticsStatisticsISBN:9781319042578Author:David S. Moore, William I. Notz, Michael A. FlignerPublisher:W. H. Freeman
 Introduction to the Practice of StatisticsStatisticsISBN:9781319013387Author:David S. Moore, George P. McCabe, Bruce A. CraigPublisher:W. H. Freeman
MATLAB: An Introduction with Applications
Statistics
ISBN:9781119256830
Author:Amos Gilat
Publisher:John Wiley & Sons Inc
Probability and Statistics for Engineering and th...
Statistics
ISBN:9781305251809
Author:Jay L. Devore
Publisher:Cengage Learning
Statistics for The Behavioral Sciences (MindTap C...
Statistics
ISBN:9781305504912
Author:Frederick J Gravetter, Larry B. Wallnau
Publisher:Cengage Learning
Elementary Statistics: Picturing the World (7th E...
Statistics
ISBN:9780134683416
Author:Ron Larson, Betsy Farber
Publisher:PEARSON
The Basic Practice of Statistics
Statistics
ISBN:9781319042578
Author:David S. Moore, William I. Notz, Michael A. Fligner
Publisher:W. H. Freeman
Introduction to the Practice of Statistics
Statistics
ISBN:9781319013387
Author:David S. Moore, George P. McCabe, Bruce A. Craig
Publisher:W. H. Freeman