
Structural Analysis
6th Edition
ISBN: 9781337630931
Author: KASSIMALI, Aslam.
Publisher: Cengage,
expand_more
expand_more
format_list_bulleted
Related questions
Concept explainers
Question
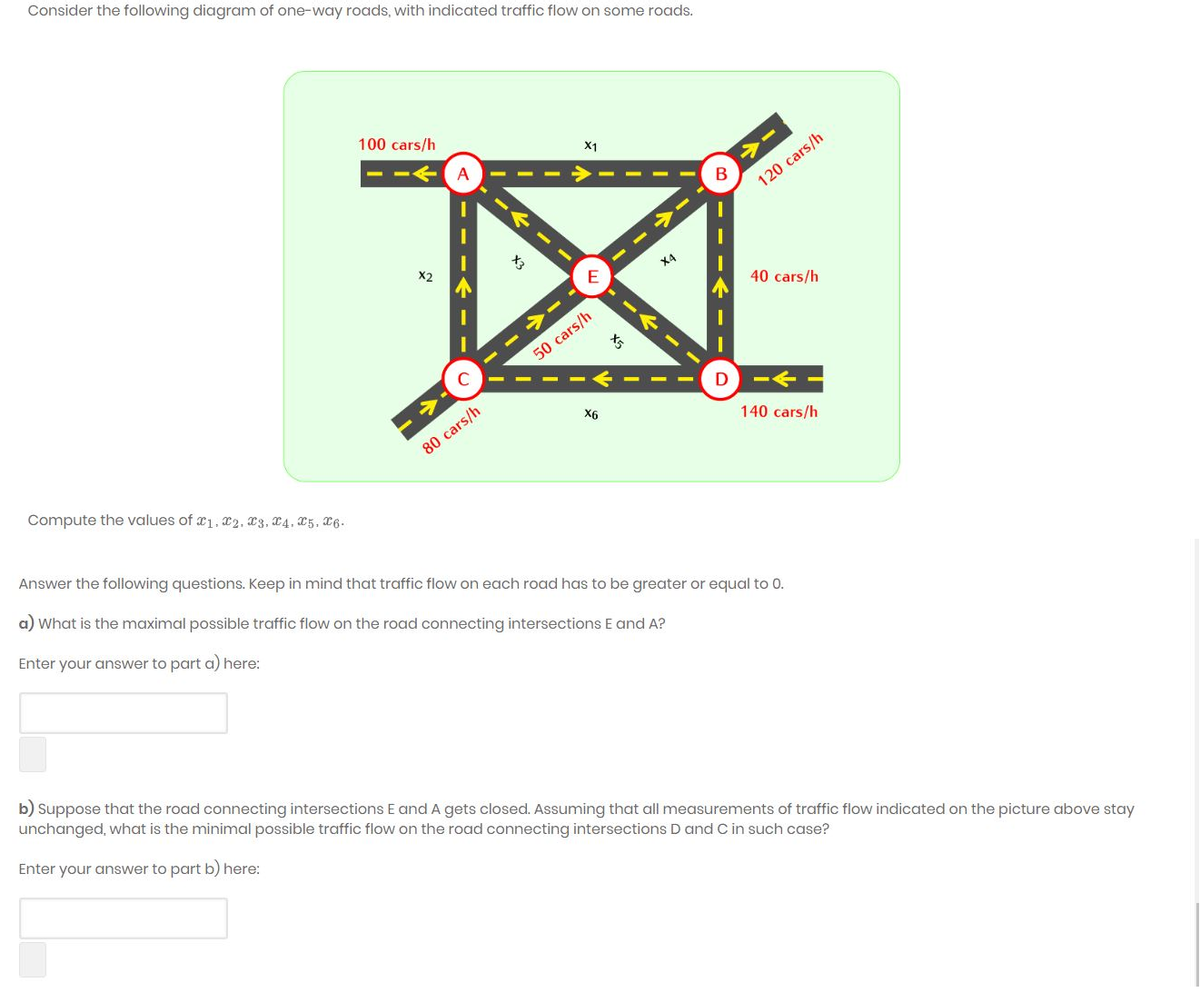

Transcribed Image Text:Consider the following diagram of one-way roads, with indicated traffic flow on some roads.
Compute the values of x1, x2, x3, x4, X5, X6.
100 cars/h
X2
A
80 cars/h
X1
50 cars/h
X6
B
ts
---- →-
120 cars/h
D
40 cars/h
140 cars/h
Answer the following questions. Keep in mind that traffic flow on each road has to be greater or equal to 0.
a) What is the maximal possible traffic flow on the road connecting intersections E and A?
Enter your answer to part a) here:
b) Suppose that the road connecting intersections E and A gets closed. Assuming that all measurements of traffic flow indicated on the picture above stay
unchanged, what is the minimal possible traffic flow on the road connecting intersections D and C in such case?
Enter your answer to part b) here:
Expert Solution
This question has been solved!
Explore an expertly crafted, step-by-step solution for a thorough understanding of key concepts.

This is a popular solution

Trending nowThis is a popular solution!

Step by stepSolved in 5 steps with 3 images

Knowledge Booster


Learn more about
Need a deep-dive on the concept behind this application? Look no further. Learn more about this topic, civil-engineering and related others by exploring similar questions and additional content below.Similar questions
- Assuming that the expression: u = ue i, can be used to describe the speed-density relationship of a highway, determine the capacity of the highway from the data below using regression analysis. k (veh/mi) u, (mi/h) 43 50 38.4 33.8 53.2 42.3 31 Under what flow conditions is the above model valid?arrow_forward4. The relation of the density (d) along a roadway to vehicle speed (s: km/h) is given as d = 50- s/2 Determine the flow (q)-speed (s) and flow (q)-density (d) relationships and draw the variations of density-speed, flow-speed and flow-density on. Show the maximum and minimum points on these graphsarrow_forwardAssume you are observing traffic in a single lane of a highway at a specific location. You measure the average headway and average spacing of passing vehicles as 3.2 seconds and 20 m, respectively. Calculate the flow, average speed, and density of the traffic stream in this lane.arrow_forward
arrow_back_ios
arrow_forward_ios
Recommended textbooks for you
 Structural Analysis (10th Edition)Civil EngineeringISBN:9780134610672Author:Russell C. HibbelerPublisher:PEARSON
 Principles of Foundation Engineering (MindTap Cou...Civil EngineeringISBN:9781337705028Author:Braja M. Das, Nagaratnam SivakuganPublisher:Cengage Learning
 Fundamentals of Structural AnalysisCivil EngineeringISBN:9780073398006Author:Kenneth M. Leet Emeritus, Chia-Ming Uang, Joel LanningPublisher:McGraw-Hill Education
 Traffic and Highway EngineeringCivil EngineeringISBN:9781305156241Author:Garber, Nicholas J.Publisher:Cengage Learning
Structural Analysis (10th Edition)
Civil Engineering
ISBN:9780134610672
Author:Russell C. Hibbeler
Publisher:PEARSON
Principles of Foundation Engineering (MindTap Cou...
Civil Engineering
ISBN:9781337705028
Author:Braja M. Das, Nagaratnam Sivakugan
Publisher:Cengage Learning
Fundamentals of Structural Analysis
Civil Engineering
ISBN:9780073398006
Author:Kenneth M. Leet Emeritus, Chia-Ming Uang, Joel Lanning
Publisher:McGraw-Hill Education
Traffic and Highway Engineering
Civil Engineering
ISBN:9781305156241
Author:Garber, Nicholas J.
Publisher:Cengage Learning