
MATLAB: An Introduction with Applications
6th Edition
ISBN: 9781119256830
Author: Amos Gilat
Publisher: John Wiley & Sons Inc
expand_more
expand_more
format_list_bulleted
Related questions
Question
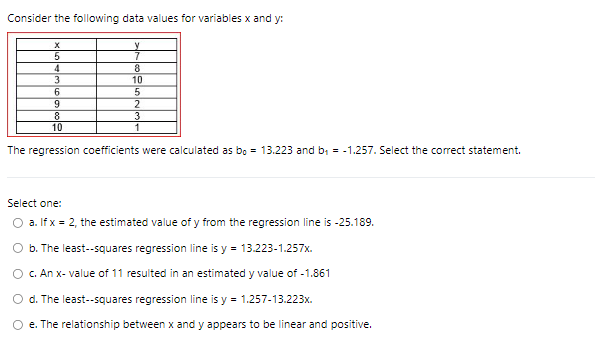

Transcribed Image Text:Consider the following data values for variables x and y:
Ť
8
10
5
2
3
1
X
5
4
3
6
9
8
10
The regression coefficients were calculated as bo = 13.223 and b₁ = -1.257. Select the correct statement.
Select one:
O a. If x = 2, the estimated value of y from the regression line is -25.189.
b. The least--squares regression line is y = 13.223-1.257x.
c. An x-value of 11 resulted in an estimated y value of -1.861
d.
The least--squares regression line is y = 1.257-13.223x.
e. The relationship between x and y appears to be linear and positive.
Expert Solution
This question has been solved!
Explore an expertly crafted, step-by-step solution for a thorough understanding of key concepts.

Step by stepSolved in 3 steps with 3 images

Knowledge Booster

Similar questions
- The following table number of absences (x) and the grade earned on the first exam (y) for a Statistics class. 3. 9. 5 8. y 86 76 91 54 84 54 The least-squares regression line is in the form y= bo + b,x. Compute the value of bo. That is, compute the intercept. Round your answer to two decimal places. Write only a number as your answer. Your Answer: Answerarrow_forwardUsing 23 observations on each variable, a computer program generated the following multiple regression model. y = 65.5 +9.56x1+3.27x2-4.23x3– 9.23x4 If the standard errors of the coefficients of the independent variables are, respectively, 3.44, 2.30, 2.76, and 4.99, can you conclude that the independent variable x, is needed in the regression model? Let B1, B2, Ba denote the coefficients of the 4 variables in this model, and use a two-sided hypothesis test and significance level of 0.10 to determine your 4 .../ answer. (a) State the null hypothesis H, and the alternative hypothesis H,. H, : 0 H, : 0 (b) Determine the type of test statistic to use. Degrees of freedom: D=0 OSO (c) Find the value of the test statistic. (Round to two or more decimal places.) O#0 OO (d) Find the two critical values at the 0.10 level of significance. (Round to two or more decimal places.) | and || (e) Can you conclude that the independent variable is needed in the regression model? Yes No 미arrow_forwardCompute the least-squares regression equation for the given data set. Use a TI-84 calculator. Round the slope and y-intercept to at least four decimal places. 43 37 15 19 24 37 18 y 72 67 25 29 42 65 32 Send data to Excel Regression line equation: y = 1.7777x + 1.5838arrow_forward
- Suppose Wesley is a marine biologist who is interested in the relationship between the age and the size of male Dungeness crabs. Wesley collects data on 1,000 crabs and uses the data to develop the following least-squares regression line where X is the age of the crab in months and Y is the predicted value of Y, the size of the male crab in cm. Y = 8.2052 + 0.5693X What is the value of Ý when a male crab is 21.7865 months old? Provide your answer with precision to two decimal places. Interpret the value of Ý. The value of Ý is the probability that a crab will be 21.7865 months old. the predicted number of crabs out of the 1,000 crabs collected that will be 21.7865 months old. the predicted incremental increase in size for every increase in age by 21.7865 months. the predicted size of a crab when it is 21.7865 months old.arrow_forwardQ3: From the following data: 2 5 y 5 4 6 3 1) Draw scatter plot. 2) Determine the regression line y = a + b x. 3) Predict the value of y for the value of x = 4.6. 4) Calculate the correlation coefficient. 4 8 3 5arrow_forward18. Give the following data, which is the equation of the regression line? 3 4 12 Y 8. 6. 9. 12 C. y = 4.98 + 0.725 d. y = 4,88 + 0.525 a. y = 4.88+ 0.625x %3D b. y = 4.98 +0.425x 19. Which of the following gives the best fit of the line for a given data? a. y = 2+ 6.5x, r = 0.65 b. y = 6.05 + 0.825x, r = 0.64 c. y = -1.10 + 9x, r = -0.72 d. y = 100 + 75x, r = 0.50arrow_forward
- 26. For the following scores: X 3 5 2 2 4 1 4 Y 8 8 6 3 6 4 7 a. Find the regression equation for predicting Y from X. b. Calculate the predicted Y value for each X.arrow_forwardBelow table contains a data sample where X is the independent, and Y the dependent variable. Using the data, please conduct a regression analysis. Determine first the regression equation with the help of below graph and table, then answer all the questions. 1. The value of cell a is 2. The value of cell b is 3: The value of cell c is 4: The value of cell d is 5: The value of cell e is 6: The value of cell f is 7: The value of cell g is 8. The value of cell h is 9: The value of cell i is 10: The value of cell j is 11: The value of cell k is 12: The value of cell l is 13: The value of cell m is 14: The value of cell n is 15: The value of cell o is 16: The value of cell p is 17: The value of cell q is 18: The value of cell r is 19: The value of cell s is 20: The value of cell t is 21: The value of cell u is 22: The value of cell v is 23: The value of cell w is 24: The value of cell x is 25: The value of cell y is 26: The value of cell z is 27: The value of cell aa is 28: The value of cell…arrow_forwardIn the graph shown below consider the horizontal line to represent the average y value for the data set and the slant line to represent the linear regression equation. use only the graph of the data to do the following:arrow_forward
arrow_back_ios
arrow_forward_ios
Recommended textbooks for you
- MATLAB: An Introduction with ApplicationsStatisticsISBN:9781119256830Author:Amos GilatPublisher:John Wiley & Sons Inc
 Probability and Statistics for Engineering and th...StatisticsISBN:9781305251809Author:Jay L. DevorePublisher:Cengage Learning
 Statistics for The Behavioral Sciences (MindTap C...StatisticsISBN:9781305504912Author:Frederick J Gravetter, Larry B. WallnauPublisher:Cengage Learning
  Elementary Statistics: Picturing the World (7th E...StatisticsISBN:9780134683416Author:Ron Larson, Betsy FarberPublisher:PEARSON
 The Basic Practice of StatisticsStatisticsISBN:9781319042578Author:David S. Moore, William I. Notz, Michael A. FlignerPublisher:W. H. Freeman
 Introduction to the Practice of StatisticsStatisticsISBN:9781319013387Author:David S. Moore, George P. McCabe, Bruce A. CraigPublisher:W. H. Freeman
MATLAB: An Introduction with Applications
Statistics
ISBN:9781119256830
Author:Amos Gilat
Publisher:John Wiley & Sons Inc
Probability and Statistics for Engineering and th...
Statistics
ISBN:9781305251809
Author:Jay L. Devore
Publisher:Cengage Learning
Statistics for The Behavioral Sciences (MindTap C...
Statistics
ISBN:9781305504912
Author:Frederick J Gravetter, Larry B. Wallnau
Publisher:Cengage Learning
Elementary Statistics: Picturing the World (7th E...
Statistics
ISBN:9780134683416
Author:Ron Larson, Betsy Farber
Publisher:PEARSON
The Basic Practice of Statistics
Statistics
ISBN:9781319042578
Author:David S. Moore, William I. Notz, Michael A. Fligner
Publisher:W. H. Freeman
Introduction to the Practice of Statistics
Statistics
ISBN:9781319013387
Author:David S. Moore, George P. McCabe, Bruce A. Craig
Publisher:W. H. Freeman