Glencoe Algebra 1, Student Edition, 9780079039897, 0079039898, 2018
18th Edition
ISBN: 9780079039897
Author: Carter
Publisher: McGraw Hill
expand_more
expand_more
format_list_bulleted
Question

Transcribed Image Text:Sure! Here's the transcription of the text from the image:
---
1. ☐ Yes, because it is expected that as the *safety rating* increases then the *cost* should decrease.
2. ☐ No, because it is expected that as the *safety rating* increases then the *cost* should also increase.
3. ☐ Yes, because it is expected that as the *safety rating* increases then the *cost* should also increase.
4. ☐ No, because it is expected that as the *safety rating* increases then the *cost* should decrease.
---
There are no graphs or diagrams present in the image.

Transcribed Image Text:**Transcription: Educational Context**
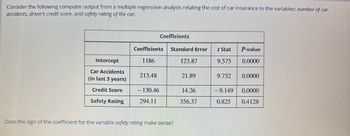
Consider the following computer output from a multiple regression analysis relating the cost of car insurance to the variables: number of car accidents, driver's credit score, and safety rating of the car.
| Coefficients | Coefficients | Standard Error | t Stat | P-value |
|------------------|--------------|----------------|--------|---------|
| Intercept | 1186 | 123.87 | 9.575 | 0.0000 |
| Car Accidents (In last 3 years) | 213.48 | 21.89 | 9.752 | 0.0000 |
| Credit Score | -130.46 | 14.26 | -9.149 | 0.0000 |
| Safety Rating | 294.11 | 356.37 | 0.825 | 0.4128 |
**Explanation of Coefficients Table:**
- **Intercept**: The baseline cost of insurance is represented by the intercept, which is 1186. This is the estimated cost when all other variables are zero.
- **Car Accidents**: For each additional car accident in the last three years, the cost of insurance increases by 213.48. The small P-value (0.0000) indicates this is a statistically significant predictor.
- **Credit Score**: A higher credit score is associated with a decrease in insurance costs, as shown by the coefficient of -130.46. This predictor is statistically significant with a P-value of 0.0000.
- **Safety Rating**: While a higher safety rating shows an increase in cost by 294.11, this factor is not statistically significant given the P-value of 0.4128.
**Question for Learners:**
Does the sign of the coefficient for the variable safety rating make sense? Reflect on why a higher safety rating might not be expected to increase costs and whether this result could be due to statistical variance or model specification issues.
Expert Solution
This question has been solved!
Explore an expertly crafted, step-by-step solution for a thorough understanding of key concepts.
This is a popular solution
Trending nowThis is a popular solution!
Step by stepSolved in 3 steps with 1 images

Knowledge Booster
Similar questions
- The ability of regression analysis to measure the impact of one variable on the dependent variable? How.arrow_forwardBriefly discuss the effect on a regression analysis of dependencies among the observations of the response variablearrow_forwardInterpret the slope of the least square regression line in contentarrow_forward
arrow_back_ios
arrow_forward_ios
Recommended textbooks for you
 Glencoe Algebra 1, Student Edition, 9780079039897...AlgebraISBN:9780079039897Author:CarterPublisher:McGraw Hill
 Big Ideas Math A Bridge To Success Algebra 1: Stu...AlgebraISBN:9781680331141Author:HOUGHTON MIFFLIN HARCOURTPublisher:Houghton Mifflin Harcourt
 Holt Mcdougal Larson Pre-algebra: Student Edition...AlgebraISBN:9780547587776Author:HOLT MCDOUGALPublisher:HOLT MCDOUGAL
 Algebra and Trigonometry (MindTap Course List)AlgebraISBN:9781305071742Author:James Stewart, Lothar Redlin, Saleem WatsonPublisher:Cengage Learning
 College AlgebraAlgebraISBN:9781305115545Author:James Stewart, Lothar Redlin, Saleem WatsonPublisher:Cengage Learning

Glencoe Algebra 1, Student Edition, 9780079039897...
Algebra
ISBN:9780079039897
Author:Carter
Publisher:McGraw Hill


Big Ideas Math A Bridge To Success Algebra 1: Stu...
Algebra
ISBN:9781680331141
Author:HOUGHTON MIFFLIN HARCOURT
Publisher:Houghton Mifflin Harcourt

Holt Mcdougal Larson Pre-algebra: Student Edition...
Algebra
ISBN:9780547587776
Author:HOLT MCDOUGAL
Publisher:HOLT MCDOUGAL

Algebra and Trigonometry (MindTap Course List)
Algebra
ISBN:9781305071742
Author:James Stewart, Lothar Redlin, Saleem Watson
Publisher:Cengage Learning

College Algebra
Algebra
ISBN:9781305115545
Author:James Stewart, Lothar Redlin, Saleem Watson
Publisher:Cengage Learning