
MATLAB: An Introduction with Applications
6th Edition
ISBN: 9781119256830
Author: Amos Gilat
Publisher: John Wiley & Sons Inc
expand_more
expand_more
format_list_bulleted
Related questions
Question
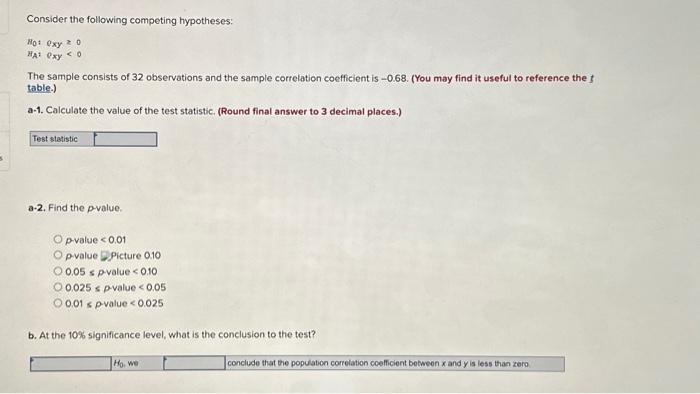

Transcribed Image Text:Consider the following competing hypotheses:
Hot Oxy 20
HA: Oxy < 0
The sample consists of 32 observations and the sample correlation coefficient is -0.68. (You may find it useful to reference the f
table.)
a-1. Calculate the value of the test statistic. (Round final answer to 3 decimal places.)
Test statistic
a-2. Find the p-value.
Op-value <0.01
O p-valuePicture 0.10
O 0.05 s p-value < 0.10
O 0.025 s p-value < 0.05
O 0.01 s p-value < 0.025
b. At the 10% significance level, what is the conclusion to the test?
Ho, we
conclude that the population correlation coefficient between x and y is less than zero
Expert Solution
This question has been solved!
Explore an expertly crafted, step-by-step solution for a thorough understanding of key concepts.

Step by stepSolved in 5 steps with 6 images

Knowledge Booster

Similar questions
- Use the data values in the table below to calculate the correlation between the variables x and y.Submit the link through Canvas to either a photo of your work on paper or a link to a google sheet. x y 3 19.13 4 21.24 5 19.65 6 18.36 7 17.57 8 18.98 9 16.99 10 16.7 Give your answer to three decimal places. __?__arrow_forwardAssume that you have paired values consisting of heights (in inches) and weights (in lb) from 40 randomly selected men. The linear correlation coefficient r is 0.594. Find the value of the coefficient of determination. What practical information does the coefficient of determination provide? Choose the correct answer below. O A. The coefficient of determination is 0.353. 64.7% of the variation is explained by the linear correlation, and 35.3% is explained by other factors. O B. The coefficient of determination is 0.647. 35.3% of the variation is explained by the linear correlation, and 64.7% is explained by other factors. O C. The coefficient of determination is 0.647. 64.7% of the variation is explained by the linear correlation, and 35.3% is explained by other factors. O D. The coefficient of determination is 0.353. 35.3% of the variation is explained by the linear correlation, and 64.7% is explained by other factors.arrow_forwardThe variable crime increases at the same rate the variable number of churches increases for the top 10 towns in a given area in New York. Which of the following conclusions would be most accurate based on your understanding of pearson correlation. A. All of the above. B. Decreasing the number of churches in an area will decrease the crime in that area. C. Towns with more churches tend to expereience more crime D. Increasing the number of churches in an area will increase the amount of crime in that area.arrow_forward
- Answer D questions onlyarrow_forwardTinder and Online Dating: Everything Up to the Pearson Coefficient Which statistical test could be used to determine if there was a relationship between the two variables, degree of narcissism and quality of jawline? a. z test b. single-sample t test c. paired-samples t test d. independent-samples t test e. one-way between-groups ANOVA f. one-way within-groups ANOVA g. two-way between-groups ANOVA h. Pearson Correlation Coefficientarrow_forwardYou wish to determine if there is a linear correlation between the age of a driver and the number of driver deaths. The following table represents the age of a driver and the number of driver deaths per 100,000. Use a significance level of 0.01 and round all values to 4 decimal places. Driver Age 65 69 48 37 49 27 62 64 Ho: p = 0 Ha: p = 0 r= Find the p-value p-value= Number of Driver Deaths per 100,000 22 22 34 Find the Linear Correlation Coefficient The p-value is Greater than a Less than (or equal to) a 23 28 20 The p-value leads to a decision to O Do Not Reject Ho O Accept Ho O Reject Ho 33 33 The conclusion is O There is a significant negative linear correlation between driver age and number of driver deaths. There is a significant linear correlation between driver age and number of driver deaths. O There is insufficient evidence to make a conclusion about the linear correlation between driver age and number of driver deaths. O There is a significant positive linear correlation…arrow_forward
- 6. Which of the following are true? Select all that apply. a. The coefficient of determination is the proportion of variation in the response variable that is explained by the regression line. b. We often use the symbol r to represent the coefficient of determination. c. In simple linear regression, the coefficient of determination equals the square of the linear correlation coefficient r. d. The closer the regression line comes to the data points, r should go to eleven.arrow_forwardHere is a scatter plot for a set of bivariate data. Q What would you estimate the correlation coefficient to be? -0.9 -0.60 0.6 0.9 O Video Question Help: Submit Questionarrow_forward
arrow_back_ios
arrow_forward_ios
Recommended textbooks for you
- MATLAB: An Introduction with ApplicationsStatisticsISBN:9781119256830Author:Amos GilatPublisher:John Wiley & Sons Inc
 Probability and Statistics for Engineering and th...StatisticsISBN:9781305251809Author:Jay L. DevorePublisher:Cengage Learning
 Statistics for The Behavioral Sciences (MindTap C...StatisticsISBN:9781305504912Author:Frederick J Gravetter, Larry B. WallnauPublisher:Cengage Learning
  Elementary Statistics: Picturing the World (7th E...StatisticsISBN:9780134683416Author:Ron Larson, Betsy FarberPublisher:PEARSON
 The Basic Practice of StatisticsStatisticsISBN:9781319042578Author:David S. Moore, William I. Notz, Michael A. FlignerPublisher:W. H. Freeman
 Introduction to the Practice of StatisticsStatisticsISBN:9781319013387Author:David S. Moore, George P. McCabe, Bruce A. CraigPublisher:W. H. Freeman
MATLAB: An Introduction with Applications
Statistics
ISBN:9781119256830
Author:Amos Gilat
Publisher:John Wiley & Sons Inc
Probability and Statistics for Engineering and th...
Statistics
ISBN:9781305251809
Author:Jay L. Devore
Publisher:Cengage Learning
Statistics for The Behavioral Sciences (MindTap C...
Statistics
ISBN:9781305504912
Author:Frederick J Gravetter, Larry B. Wallnau
Publisher:Cengage Learning
Elementary Statistics: Picturing the World (7th E...
Statistics
ISBN:9780134683416
Author:Ron Larson, Betsy Farber
Publisher:PEARSON
The Basic Practice of Statistics
Statistics
ISBN:9781319042578
Author:David S. Moore, William I. Notz, Michael A. Fligner
Publisher:W. H. Freeman
Introduction to the Practice of Statistics
Statistics
ISBN:9781319013387
Author:David S. Moore, George P. McCabe, Bruce A. Craig
Publisher:W. H. Freeman