
ENGR.ECONOMIC ANALYSIS
14th Edition
ISBN: 9780190931919
Author: NEWNAN
Publisher: Oxford University Press
expand_more
expand_more
format_list_bulleted
Related questions
Question
Consider the figure below. The situation in Trombli is characterized by SRAS1 and AD1 when there is an increase in the money supply shifting the short-run
|
|||
|
|||
|
|||
|
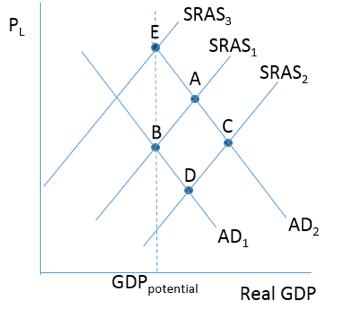

Transcribed Image Text:This image depicts a macroeconomic model featuring Aggregate Demand (AD) and Short-Run Aggregate Supply (SRAS) curves.
### Key Points:
1. **Axes**:
- The vertical axis represents the price level (\(P_L\)).
- The horizontal axis represents Real GDP.
2. **Curves**:
- **SRAS Curves (Short-Run Aggregate Supply)**: There are three SRAS curves labeled \(SRAS_1\), \(SRAS_2\), and \(SRAS_3\). These curves slope upward, indicating that as the price level increases, the quantity of goods and services firms are willing to supply also increases.
- **AD Curves (Aggregate Demand)**: There are two AD curves labeled \(AD_1\) and \(AD_2\). These curves slope downward, showing that as the price level decreases, the quantity of goods and services demanded increases.
3. **Equilibrium Points**:
- **Point A**: Intersection of \(AD_1\) and \(SRAS_1\).
- **Point B**: Intersection of \(AD_1\) and \(SRAS_3\).
- **Point C**: Intersection of \(AD_2\) and \(SRAS_2\).
- **Point D**: Intersection of \(AD_1\) and \(AD_2\), but not along a supply curve.
- **Point E**: Intersection of \(AD_2\) and \(SRAS_3\).
4. **GDP Potential Line**: A vertical dashed line labeled "GDP potential" marks the level of output the economy can sustain in the long run without causing inflation.
This diagram can illustrate shifts in supply and demand, showing how they affect the equilibrium price level and output. Each intersection shows potential states of the economy, with movements between these points representing changes due to factors such as policy shifts, external shocks, or changes in consumer behavior.
Expert Solution
This question has been solved!
Explore an expertly crafted, step-by-step solution for a thorough understanding of key concepts.

This is a popular solution

Trending nowThis is a popular solution!

Step by stepSolved in 2 steps

Knowledge Booster


Learn more about
Need a deep-dive on the concept behind this application? Look no further. Learn more about this topic, economics and related others by exploring similar questions and additional content below.Similar questions
- 5. Short-run shocks in the AD-AS model The following graph shows an economy that is initially in equilibrium. Then, a large decline in stock prices occurs, reducing the wealth of individuals. On the graph, show the economic impact of this event in the short-run aggregate demand and aggregate supply (AD–AS) model by shifting one or both curves. Show the movement of the AD and SRAS on a graph. This event is an example of a decrease in AD/increase in AD/ decrease in SRAS/ increase in SRAS. As a result, the price level declines/rises, and the equilibrium real GDP declines/rises.arrow_forwardSuppose country A has a central bank with full credibility, and country B has a central bank with no credibility.Using a graph of aggregate demand and supply explain (a long explanation) how the credibility of each country’s central bank affect economic outcomes, if both countries are hit with the same b) negative temporary aggregate supply shock?arrow_forwardAnswering all questions compulsory...arrow_forward
- 1. Assume that the AD curve of the economy is given by Y = 15 – 100t + ñ, where m is a demand shock (animal spirits, government spending, or money supply). The AS curve is given by 1 TT = En + (Y – Ỹ) + ū, 50 where v is a supply shock (oil price, productivity). The variable n is the inflation rate, En is expected inflation rate, Y is output, and Y is long-run output. For numerical values, Y = 10, ñ = ū = 0. Answer each equation using both graphs and math. a. Plot the above AD-AS curves on the (Y, t) diagram. Describe the slopes of both the AD curve and the AS curve. b. If the economy is currently at its long-run trend, what should be the equilibrium output? What is the equilibrium inflation rate in this economy? What should be the equilibrium expected inflation rate in this economy? Assume that expected inflation rate is constant at 5 percent. What happens when the oil price increases by 5 percent (ū = 0.05)? What is the equilibrium level of output? C. What is the equilibrium level of…arrow_forward5.5 and 5.6 pleasearrow_forwardConsider the figure to the right. If this country's government decides to increase its short-term spending, what happens to the short-run equilibrium price level, and why? Is this an example of demand-pull or cost-push inflation? Explain. 1.) Using the line drawing tool, draw either a new aggregate demand (AD) curve or a new short-run aggregate supply (AS) curve that shows the effects of temporary government spending increases. Properly label your line. 2.) Using the point drawing tool, indicate the economy's new short-run equilibrium price and level of real GDP. Label this point 'E₂.' Carefully follow the instructions above, and only draw the required objects. Price Level LRAS₁ Real GDP per Year (S trillions) AS₁ AD₁arrow_forward
- 37 In the Aggregate Supply/Aggregate Demand model, starting from long-run equilibrium, the long-run impact(s) of an increase in autonomous investment, compared to the original equilibrium, is(are): a.higher inflation. b.Higher output. c.lower inflation and lower output. d.lower inflation and higher output. e.higher inflation and higher output.arrow_forward39 Which of the following will cause a shift in the short-run aggregate supply curve? a.An increase in government spending b.A change in expected inflation c.Unanticipated inflation d.A change in investment e.A decrease in government spendingarrow_forwardSuppose country A has a central bank with full credibility, and country B has a central bank with no credibility. Assume that in 2020, both countries are hit with the same COVID-19 shock.If the both central banks announce an autonomous easing policy to reduce the unemployment rate,How does the credibility of each country’s central bank affect the speed of adjustment of the aggregate supply curve to policy announcements? How does this result affect output stability?arrow_forward
- If the economy begins at an equilibrium at potential output, a negative aggregate demand shock has which of the following effects in the short-ru? a. output and prices increase and unemployment falls below the natural rate b. output and prices increase and unemployment rises above the natural rate c. output and prices decrease and unemployment rises above the natural rate d. output and prices decrease and unemployment falls below the natural ratearrow_forward8a. Assume that an economy is at equilibrium at its potential GDP at $10 trillion and aprice level of 100. What would be the short-run impact of a significant fall in consumer confidence about the future? Provide an AD/AS model to support your answer. b. What policy would you recommend to the chairperson of the Federal Reserve? Be specific. Show the effect of this policy on your graph part a. c. What are the major goals of the Fed's monetary policy?arrow_forward
arrow_back_ios
arrow_forward_ios
Recommended textbooks for you
 Principles of Economics (12th Edition)EconomicsISBN:9780134078779Author:Karl E. Case, Ray C. Fair, Sharon E. OsterPublisher:PEARSON
 Engineering Economy (17th Edition)EconomicsISBN:9780134870069Author:William G. Sullivan, Elin M. Wicks, C. Patrick KoellingPublisher:PEARSON
 Principles of Economics (MindTap Course List)EconomicsISBN:9781305585126Author:N. Gregory MankiwPublisher:Cengage Learning
 Managerial Economics: A Problem Solving ApproachEconomicsISBN:9781337106665Author:Luke M. Froeb, Brian T. McCann, Michael R. Ward, Mike ShorPublisher:Cengage Learning
 Managerial Economics & Business Strategy (Mcgraw-...EconomicsISBN:9781259290619Author:Michael Baye, Jeff PrincePublisher:McGraw-Hill Education
Principles of Economics (12th Edition)
Economics
ISBN:9780134078779
Author:Karl E. Case, Ray C. Fair, Sharon E. Oster
Publisher:PEARSON
Engineering Economy (17th Edition)
Economics
ISBN:9780134870069
Author:William G. Sullivan, Elin M. Wicks, C. Patrick Koelling
Publisher:PEARSON
Principles of Economics (MindTap Course List)
Economics
ISBN:9781305585126
Author:N. Gregory Mankiw
Publisher:Cengage Learning
Managerial Economics: A Problem Solving Approach
Economics
ISBN:9781337106665
Author:Luke M. Froeb, Brian T. McCann, Michael R. Ward, Mike Shor
Publisher:Cengage Learning
Managerial Economics & Business Strategy (Mcgraw-...
Economics
ISBN:9781259290619
Author:Michael Baye, Jeff Prince
Publisher:McGraw-Hill Education