MATLAB: An Introduction with Applications
6th Edition
ISBN: 9781119256830
Author: Amos Gilat
Publisher: John Wiley & Sons Inc
expand_more
expand_more
format_list_bulleted
Question
thumb_up100%
correct the wrong ones plz. i will rate positive.

Transcribed Image Text:### Randomized Block Design Analysis
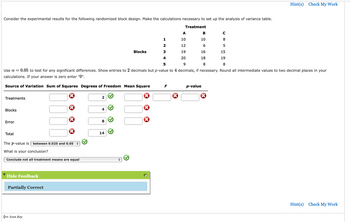
Consider the experimental results for the following randomized block design. The objective is to make the calculations necessary to set up the analysis of variance table.
#### Experimental Data
The experimental results are outlined in the table below:
| Treatment | A | B | C |
|-----------|------|------|-----|
| Block 1 | 10 | 10 | 8 |
| Block 2 | 12 | 6 | 5 |
| Block 3 | 19 | 16 | 15 |
| Block 4 | 20 | 18 | 19 |
| Block 5 | 9 | 8 | 8 |
**Note:** Use \( \alpha = 0.05 \) to test for any significant differences. Show entries to 2 decimal places but p-value to 4 decimal places, if necessary. Round all intermediate values to two decimal places in your calculations. If your answer is zero, enter "0".
#### Analysis of Variance (ANOVA) Table
Fill in the analysis of variance table based on the provided data.
| Source of Variation | Sum of Squares | Degrees of Freedom | Mean Square | F | p-value |
|---------------------|----------------|--------------------|-------------|------|---------|
| Treatments | | 2 | | | |
| Blocks | | 4 | | | |
| Error | | 8 | | | |
| Total | | 14 | | | |
The \( p \)-value is **between 0.025 and 0.05**.
**Conclusion:**
Based on the \( p \)-value:
- Select the conclusion: **Conclude not all treatment means are equal**
**Result:**
Partially Correct
**Hints and Feedback:**
Users are encouraged to review their calculations and the assignment of values in the ANOVA table to ensure compliance with the provided instructions. Remember to consider the implications of the \( p \)-value when drawing conclusions.
Expert Solution
This question has been solved!
Explore an expertly crafted, step-by-step solution for a thorough understanding of key concepts.
This is a popular solution
Trending nowThis is a popular solution!
Step by stepSolved in 4 steps

Knowledge Booster
Similar questions
Recommended textbooks for you
 MATLAB: An Introduction with ApplicationsStatisticsISBN:9781119256830Author:Amos GilatPublisher:John Wiley & Sons Inc
 Probability and Statistics for Engineering and th...StatisticsISBN:9781305251809Author:Jay L. DevorePublisher:Cengage Learning
 Statistics for The Behavioral Sciences (MindTap C...StatisticsISBN:9781305504912Author:Frederick J Gravetter, Larry B. WallnauPublisher:Cengage Learning
 Elementary Statistics: Picturing the World (7th E...StatisticsISBN:9780134683416Author:Ron Larson, Betsy FarberPublisher:PEARSON
 The Basic Practice of StatisticsStatisticsISBN:9781319042578Author:David S. Moore, William I. Notz, Michael A. FlignerPublisher:W. H. Freeman
 Introduction to the Practice of StatisticsStatisticsISBN:9781319013387Author:David S. Moore, George P. McCabe, Bruce A. CraigPublisher:W. H. Freeman

MATLAB: An Introduction with Applications
Statistics
ISBN:9781119256830
Author:Amos Gilat
Publisher:John Wiley & Sons Inc

Probability and Statistics for Engineering and th...
Statistics
ISBN:9781305251809
Author:Jay L. Devore
Publisher:Cengage Learning

Statistics for The Behavioral Sciences (MindTap C...
Statistics
ISBN:9781305504912
Author:Frederick J Gravetter, Larry B. Wallnau
Publisher:Cengage Learning

Elementary Statistics: Picturing the World (7th E...
Statistics
ISBN:9780134683416
Author:Ron Larson, Betsy Farber
Publisher:PEARSON

The Basic Practice of Statistics
Statistics
ISBN:9781319042578
Author:David S. Moore, William I. Notz, Michael A. Fligner
Publisher:W. H. Freeman

Introduction to the Practice of Statistics
Statistics
ISBN:9781319013387
Author:David S. Moore, George P. McCabe, Bruce A. Craig
Publisher:W. H. Freeman