MATLAB: An Introduction with Applications
6th Edition
ISBN: 9781119256830
Author: Amos Gilat
Publisher: John Wiley & Sons Inc
expand_more
expand_more
format_list_bulleted
Question
thumb_up100%

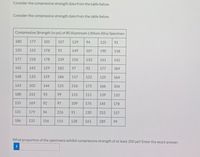
Transcribed Image Text:Consider the compressive strength data from the table below.
Consider the compressive strength data from the table below.
Compressive Strength (in psi) of 80 Aluminum-Lithium Alloy Specimen
180
177 105
107
129
94
125
91
120
152
178
92
149
107
190
118
177
218
178
239
156
133
161
142
142
142
129
182
97
93
177
189
148
133
159 186
117
122
125
164
143
102
144
125
216
175
166
104
188
242
93
99
115
111
139
110
155
169
92
97
109
176
145
178
131
179
94
226
91
130 253
157
186
132
156
115
128 161
189
99
What proportion of the specimens exhibit compressive strength of at least 200 psí? Enter the exact answer.
i
Expert Solution
This question has been solved!
Explore an expertly crafted, step-by-step solution for a thorough understanding of key concepts.
This is a popular solution
Trending nowThis is a popular solution!
Step by stepSolved in 2 steps

Knowledge Booster
Similar questions
- Exact answerarrow_forwardUse Linear, Quaratic and Cubic interpolations to solve the question.arrow_forwardA popular theory is that presidential candidates have an advantage if they are taller than their main opponents. Listed are heights (in centimeters) of randomly selected presidents along with the heights of their main opponents. Complete parts (a) and (b) below. Height (cm) of President 185 170 179 191 194 179 9 Height (cm) of Main Opponent 170 184 174 166 194 182 Identify the test statistic. t= 0.57 (Round to two decimal places as needed.) Identify the P-value P-value = 0.286 (Round to three decimal places as needed.) What is the conclusion based on the hypothesis test? Since the P-value is greater than the significance level, fail to reject the null hypothesis. There is not sufficient evidence to support the claim that presidents tend to be taller than their opponents. b. Construct the confidence interval that could be used for the hypothesis test described in part (a). What feature of the confidence interval leads to the same conclusion reached in part (a)? The confidence interval…arrow_forward
- Normal text Calibri BIUA 10 2 |II 3 I. 4 1) Freeze Inc. is an air conditioning company located in Lakeland, Florida. They collected data for the number of air conditioning units sold in the Central Florida area and for the outside temperature on the day that sales took place. The Sales Manager put the following table together: Outside Temperature Sales (Degrees F) (Number of air conditioning units sold). 68 4 72 78 8 81 10 84 14 86 15 89 21 91 20 93 22 94 25 Plot a scatter diagram for the data provided on the table above and the linear regression line calculated in topic (b). Consider that: Y: number of air conditioning units sold X: outside temperature (degrees F) Guidance: graph should look like the one presented in Figure 4.2 of textbook. Graph plotted by MS Excel, as a result of the Regression function will not be accepted. a) Perform the linear regression calculation and provide the linear regression equation that describes the relationship between Y (number of air conditioning…arrow_forwardPlease help me with Barrow_forward
arrow_back_ios
arrow_forward_ios
Recommended textbooks for you
 MATLAB: An Introduction with ApplicationsStatisticsISBN:9781119256830Author:Amos GilatPublisher:John Wiley & Sons Inc
 Probability and Statistics for Engineering and th...StatisticsISBN:9781305251809Author:Jay L. DevorePublisher:Cengage Learning
 Statistics for The Behavioral Sciences (MindTap C...StatisticsISBN:9781305504912Author:Frederick J Gravetter, Larry B. WallnauPublisher:Cengage Learning
 Elementary Statistics: Picturing the World (7th E...StatisticsISBN:9780134683416Author:Ron Larson, Betsy FarberPublisher:PEARSON
 The Basic Practice of StatisticsStatisticsISBN:9781319042578Author:David S. Moore, William I. Notz, Michael A. FlignerPublisher:W. H. Freeman
 Introduction to the Practice of StatisticsStatisticsISBN:9781319013387Author:David S. Moore, George P. McCabe, Bruce A. CraigPublisher:W. H. Freeman

MATLAB: An Introduction with Applications
Statistics
ISBN:9781119256830
Author:Amos Gilat
Publisher:John Wiley & Sons Inc

Probability and Statistics for Engineering and th...
Statistics
ISBN:9781305251809
Author:Jay L. Devore
Publisher:Cengage Learning

Statistics for The Behavioral Sciences (MindTap C...
Statistics
ISBN:9781305504912
Author:Frederick J Gravetter, Larry B. Wallnau
Publisher:Cengage Learning

Elementary Statistics: Picturing the World (7th E...
Statistics
ISBN:9780134683416
Author:Ron Larson, Betsy Farber
Publisher:PEARSON

The Basic Practice of Statistics
Statistics
ISBN:9781319042578
Author:David S. Moore, William I. Notz, Michael A. Fligner
Publisher:W. H. Freeman

Introduction to the Practice of Statistics
Statistics
ISBN:9781319013387
Author:David S. Moore, George P. McCabe, Bruce A. Craig
Publisher:W. H. Freeman