
MATLAB: An Introduction with Applications
6th Edition
ISBN: 9781119256830
Author: Amos Gilat
Publisher: John Wiley & Sons Inc
expand_more
expand_more
format_list_bulleted
Related questions
Question
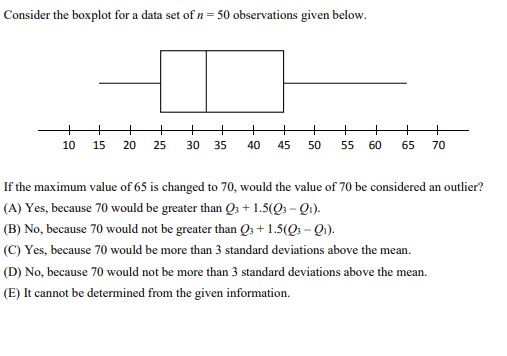

Transcribed Image Text:Consider the boxplot for a data set of n = 50 observations given below.
+
10
10
+
+
+
+
15 20
25
30 35
40 45 50 55
+
+
8.
60
65
70
If the maximum value of 65 is changed to 70, would the value of 70 be considered an outlier?
(A) Yes, because 70 would be greater than Q3 + 1.5(Q3-Q1).
(B) No, because 70 would not be greater than Q3 + 1.5(Q-Q1).
(C) Yes, because 70 would be more than 3 standard deviations above the mean.
(D) No, because 70 would not be more than 3 standard deviations above the mean.
(E) It cannot be determined from the given information.
SAVE
AI-Generated Solution
info
AI-generated content may present inaccurate or offensive content that does not represent bartleby’s views.
Unlock instant AI solutions
Tap the button
to generate a solution
to generate a solution
Click the button to generate
a solution
a solution
Knowledge Booster

Similar questions
- Here are the scores of 10 students in an introductory statistics course: 55 74 75 81 83 85 92 93 93 97 Find the interquartile range and use the 1.5 x IQR rule to check for outliers. How low would the lowest score need to be for it to be an outlier according to the rule?arrow_forwardThe table shows the weekly income of 20 randomly selected full-time students. If the student did not work, a zero was entered. (a) Check the data set for outliers. (b) Draw a histogram of the data. (c) Provide an explanation for any outliers. 186 293 591 450 230 454 422 96 238 3403 322 292 152 163 211 193 467 319 (a) List all the outliers in the given data set. Select the correct choice below and fill in any answer boxes in your choice. O A. The outlier(s) is/are (Use a comma to separate answers as needed.) O B. There are no outliers.arrow_forwardIf you were analyzing the test scores of students and determined that everyone in the class scored between 75 - 100, but one person scored 25%. That one person would be considered A:the range B:the spread C:the count D:an outlierarrow_forward
- 4. Given a data set 61, 72. 74, 74, 75, 77, 79, 88 (1) Calculate the IQR and determine any outliers. QL =P25: Q3 = P7s: (Q2 = P50 = 75) %3D IQR = Q3-Q1 1.5 IQK [Q1-1.5IQR, Q3+1.5IQR] =arrow_forward17.A scientist collects these measurements: 0.90,0.85, 0.64,0.94, 0.99, −0.02,0.56,,0.15, 0.73, 0.72, 0.89, 1.72, 0.52 Which statement is correct? A.The data value −0.02 is an outlier because it is the only number less than 0.00. b.The data value 1.72 is an outlier because it is greater than 1.5×IQR above the third quartile. C.The data value 1.72 is an outlier because it is the only number greater than 1.00 d.The data value −0.02is an outlier because it is less than 1.5×IQR below the first quartile.arrow_forwardHere is a set of data... 78 107 111 147 151 152 179 185 221 230 248 304 474 486 658 696 756 916 Identify the 5 number summary (min, Q1, median, Q3, max) MIN = 78 MEDIAN = 225.5 MAX = 916 Q1 Q2I do not remember how to get the Q1 and Q3arrow_forward
arrow_back_ios
arrow_forward_ios
Recommended textbooks for you
- MATLAB: An Introduction with ApplicationsStatisticsISBN:9781119256830Author:Amos GilatPublisher:John Wiley & Sons Inc
 Probability and Statistics for Engineering and th...StatisticsISBN:9781305251809Author:Jay L. DevorePublisher:Cengage Learning
 Statistics for The Behavioral Sciences (MindTap C...StatisticsISBN:9781305504912Author:Frederick J Gravetter, Larry B. WallnauPublisher:Cengage Learning
  Elementary Statistics: Picturing the World (7th E...StatisticsISBN:9780134683416Author:Ron Larson, Betsy FarberPublisher:PEARSON
 The Basic Practice of StatisticsStatisticsISBN:9781319042578Author:David S. Moore, William I. Notz, Michael A. FlignerPublisher:W. H. Freeman
 Introduction to the Practice of StatisticsStatisticsISBN:9781319013387Author:David S. Moore, George P. McCabe, Bruce A. CraigPublisher:W. H. Freeman
MATLAB: An Introduction with Applications
Statistics
ISBN:9781119256830
Author:Amos Gilat
Publisher:John Wiley & Sons Inc
Probability and Statistics for Engineering and th...
Statistics
ISBN:9781305251809
Author:Jay L. Devore
Publisher:Cengage Learning
Statistics for The Behavioral Sciences (MindTap C...
Statistics
ISBN:9781305504912
Author:Frederick J Gravetter, Larry B. Wallnau
Publisher:Cengage Learning
Elementary Statistics: Picturing the World (7th E...
Statistics
ISBN:9780134683416
Author:Ron Larson, Betsy Farber
Publisher:PEARSON
The Basic Practice of Statistics
Statistics
ISBN:9781319042578
Author:David S. Moore, William I. Notz, Michael A. Fligner
Publisher:W. H. Freeman
Introduction to the Practice of Statistics
Statistics
ISBN:9781319013387
Author:David S. Moore, George P. McCabe, Bruce A. Craig
Publisher:W. H. Freeman