Question
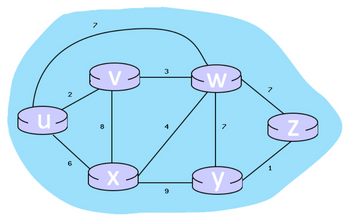
Consider the 6-node network shown below, with the given link costs.
Using Dijkstra's algorithm, find the least cost path from source node u to all other destinations and provide the resulting routing table. Show your work in tabular format.

Transcribed Image Text:n
2
9
7
8
V
X
3
4
9
-W
7
D
1
1
N
EZ
Expert Solution
This question has been solved!
Explore an expertly crafted, step-by-step solution for a thorough understanding of key concepts.
This is a popular solution
Trending nowThis is a popular solution!
Step by stepSolved in 3 steps with 6 images

Knowledge Booster
Similar questions
- P17. In Figure 5.13 , consider the path information that reaches stub networks W, X, and Y. Based on the information available at W and X, what are their respective views of the network topology? Justify your answer. The topology view at Y is shown below.arrow_forwardP7. Examine the network fragment below. w and y are x's only neighbours. W's minimum-cost route to u (not illustrated) is 5, while y's is 6. The pathways from w and y to u and between them are not indicated. All network link costs are positive integers. 2, Give x's distance vector to w, y, and u.arrow_forwardPlease please sir answerarrow_forward
- Consider the 6-node network shown below, with the given link costs. Using Dijkstra's algorithm, find the least cost path from source node u to all other destinations. Fill in the following table using the convention shown the text. I am having trouble identifying the D(u), p(u) of this table. Could you help me, please?arrow_forwardLook at this network fragment. w and y are x's only neighbors. W's minimum-cost path to u (not illustrated) is 5, while y's is 6. The pathways from w and y to u and between them are not indicated. All network link costs are positive integers. 2, Give x's distance vector to w, y, and u.arrow_forwardHow would you write a system of linear equations based on the given scenario and directions? Scenario You are employed as a network engineer and have been asked to analyze a communication network to determine the current data rates and ensure that the links aren’t at risk of “reaching capacity.” In the following figure of the network, the sender is transmitting data at a total rate of 100+50 = 150 megabits per second (Mbps). The data is transmitted from the sender to the receiver over a network of five different routers. These routers are labeled A, B, C, D, and E. The connections and data rates between the routers are labeled as x1,x2, x3, x4, and x5 . Directions For this assignment, you will analyze the communication network and solve for the unknown data rates using a variety of techniques. The system can be modeled mathematically as a system of linear equations by writing an equation for each node/router in the network. Each of these equations can be written by noting that the sum…arrow_forward
- Distance-Vector and link state are two popular algorithms that have been implemented by RIP and OSPF for intra-domain routing. Summarize the differences between the two approaches.arrow_forwardc) Given graph G=(N,E), where N is the set of routers and E is the set of links. Using Dijkstra's link-state routing algorithm compute the least cost path from node U to all other nodes and show the resulting least-cost-path tree from U. Show all calculations to get full credit. 1 2 3 2 3 3 2 2arrow_forward1arrow_forward
- Consider the network shown in the figure below, and assume that each node initially knows the costs to each of its neighbors. If the distance-vector algorithm is used by all the routers, what would be the distance table entries at node E?arrow_forwardA 3 5 сл 2 B 1 3 E F 7. Consider the network from the problem running distance-vector routing has already achieved convergence. At some time link B-C fails. a) Give the routing tables at A and D after B and C have reported the news. b) Give the routing tables at A and D after their next mutual exchange.arrow_forward
arrow_back_ios
arrow_forward_ios